This content is provided for informational and educational purposes only, and should not be relied upon as legal, business, investment, or tax advice. Furthermore, references to any securities or digital assets are for illustrative purposes only and do not constitute an investment recommendation or offer to provide investment advisory services. Factomind cannot be responsible for your use of the information provided in this content. Factomind has established, maintained, and enforced strict internal policies and procedures designed to identify and effectively manage conflicts of interest related to its business activities. Factomind does not own any digital assets mentioned below, nor has it made any purchases or sales of the digital assets mentioned below. All materials in this research paper are sourced from publicly available information.
4. The Intentions of the (Suspected) Wash Trading
Up until now, we examined the status quo of the NFT market and deliberately delayed our analysis of the underlying motivations to Section 4.
While we have utilized statistical methods to identify the potential drivers of suspected wash trading behavior, it is important to note that statistical significance does not guarantee causality. The following insights presented hereunder are primarily data-driven, but may include some subjective interpretation.
We developed two hypotheses regarding the intentions: One, the passive wash trading, which refers to wash trading activities carried out by individuals who have no incentive alignment with the project’s success, and two, the active wash trading, which is done to artificially boost the project’s growth.
In simpler terms, the ‘passive wash trading’ is similar to people swapping a ETH-USDC pair back and forth on a Testnet to be eligible for an upcoming airdrop, whereas the ‘active wash trading’ is similar to a stakeholder of the project fabricating trading volume on an exchange to make it seem more attractive.
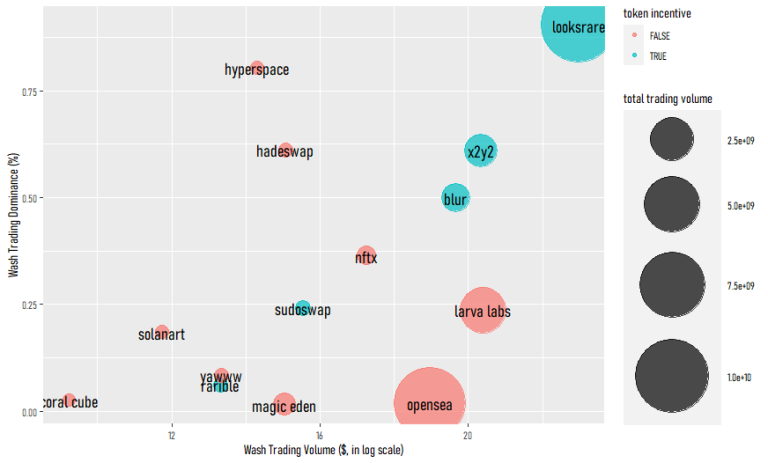
Wash trading is mostly and mostwhere a token phenomenon. 92% of the suspected wash trading volume occur at the marketplaces that offers token incentives for trading (or listing).
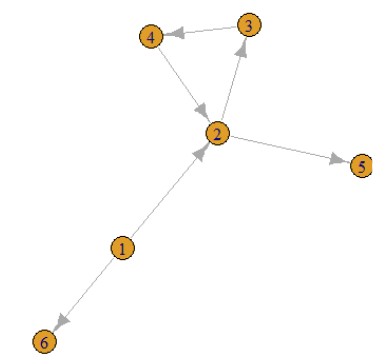
Figure 1 – Transaction Graph for Logic 1
* Data as of Feb 2023
If we take only sizeable marketplaces (that is, ruling out marketplaces with <$1M annual trading volume, represented by small dots in Figure 9), we can clearly observe the binary distinction between incentivized marketplaces (denoted by blue circles) and non-incentivized marketplaces (denoted by red circles).
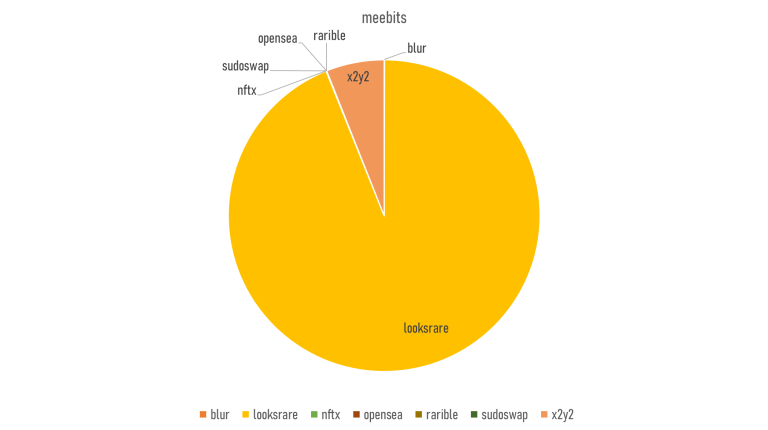
Figure 10 – The Suspected Wash Trading of Meebits by Marketplace
Meebits, for example, had a 95% suspected wash trading volume dominance as indicated previously; but if we look at the marketplace composition of the suspected wash trades, the majority of wash trades were carried out in Looksrare and X2Y2–the incentivized marketplaces–and almost no wash trade was done in any other exchanges.
From the information, we might safely conclude that most suspected wash trades are attributable to token incentives.
4.2. Can Projects Boost Normal Trading Volume and Normal Floor Price with Wash Trading? — Active Wash Trading
Boosting trading volume and floor price with wash trading looks possible, but the effect is either negligible or transient.
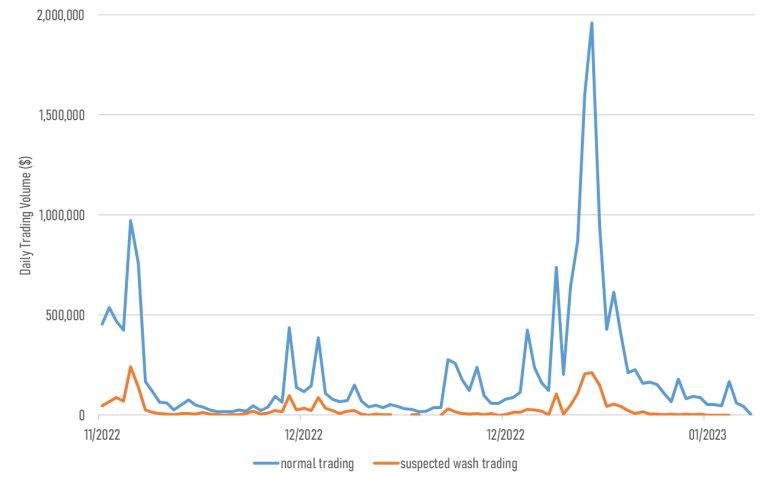
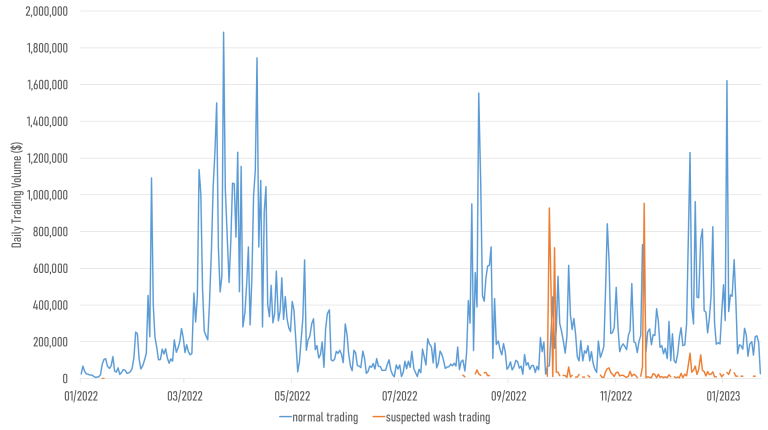
As visible from Figure 10, wash trading and normal trading exhibit a strong concurrence. However, the impact on wash trading on normal trading afterwards (wash trading volume today affecting normal trading volume tomorrow), was somewhat dubious.
Figure 11 – The Sample Time Series of Trading Volume of an NFT Collection
We performed Granger causality test and lagged linear regression to estimate the relationship between the suspected wash trading volume and normal trading volume.
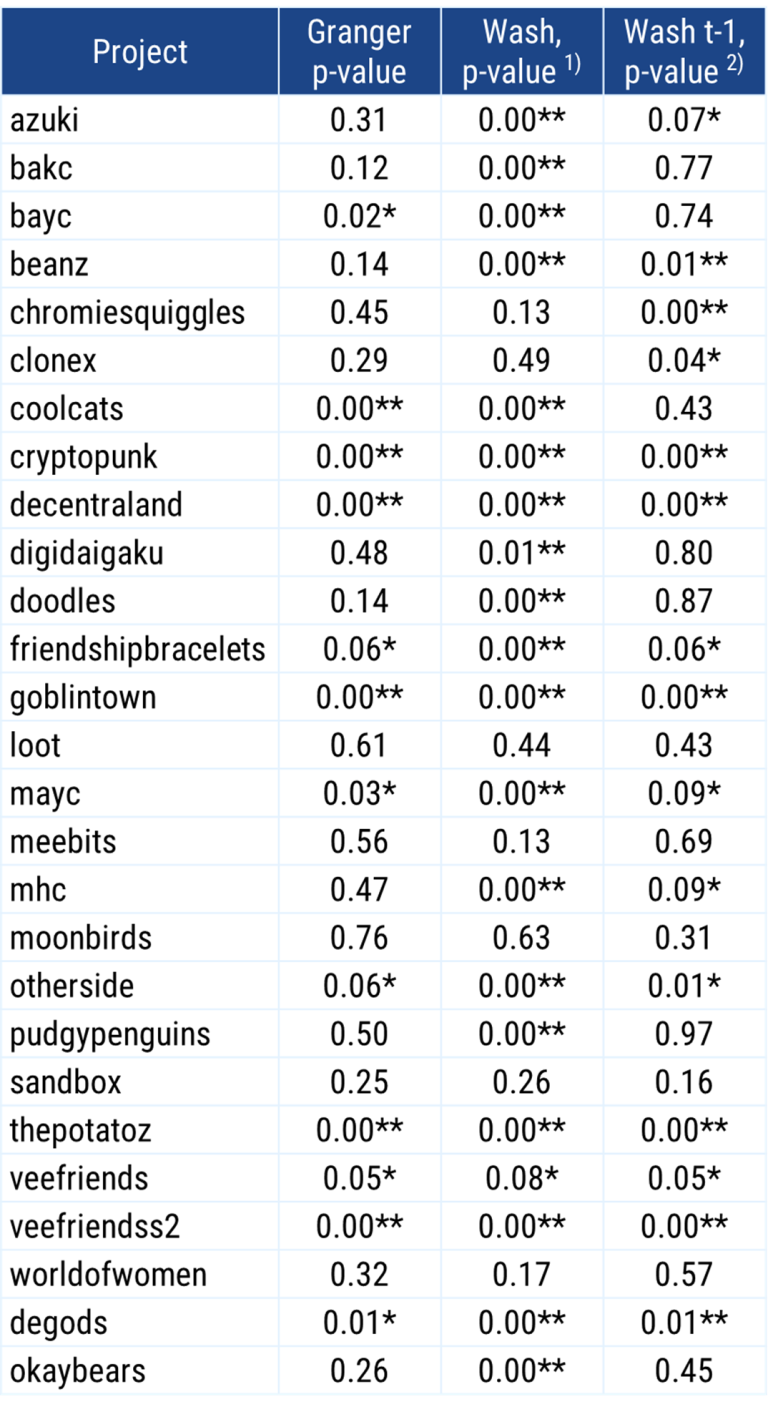
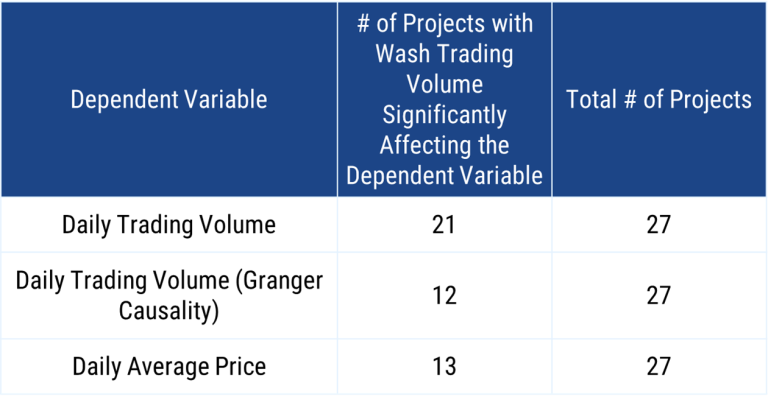
Table 2 – Test Results for the Suspected Wash Trading Volume on Normal Trading Volume
1) Impact on (suspected) Wash Trading on Normal Trading on the same day
2) Impact on (suspected) Wash Trading on Normal Trading on 1-day lag
* Significant at 10% level
* Significant at 1% level
Table 3 – Test Result for the Suspected Wash Trading Volume on Normal Trading Volume
The above study could be summarized as follows:
1) Suspected wash trading volume is highly correlated with normal trading volume in the same timeframe.
2) Suspected wash trading volume weakly causes normal trading volume.
3) Suspected wash trading volume is weakly correlated with the average price.
Overall, suspected wash trading on NFT collections is able to attract temporary public attention, as denoted by the high correlation between two types of trading volumes, but the attention span is very short-lived.
4.3. Can Projects Ignite Growth (or Revive) with Wash Trading? — Active Wash Trading
To give a conclusion first, such a situation is yet unprecedented, so we provide an inconclusive negative opinion on the issue, or “we think not.”
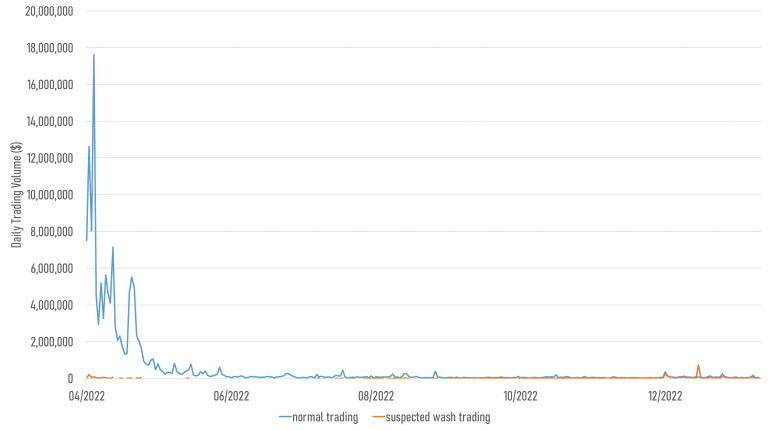
Figure 12 – The Trading Volume Time Series of DeGods
Figure 13 – The Trading Volume Time Series of Okay Bears
If we look at the only (at least currently) second mover in the NFT market to scale after Ethereum, which is Solana, we might be tempted to conclude that the growth was triggered by suspected wash trading if there is any evidence of wash trades in the initial stage.
However, contrary to the supposition, leading projects in Solana NFTs had near null wash trading activities during the initial growth stage; rather their suspected wash trades increased only after they went mainstream.
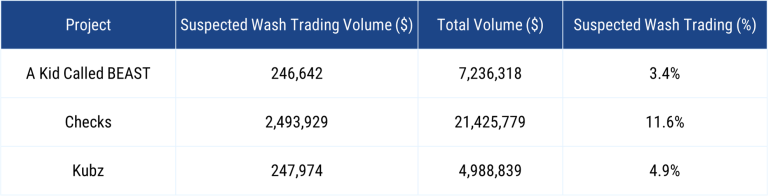
Table 4 – Suspected Wash Trading Volume from New NFT Collections
Table 4 exhibits the properties of NFT collections that were launched in the last quarter of 2022, and had the highest trading volume among the candidates in Dec 2022 and Jan 2023.
If we could detect any suspicious trading activity in the above collection, we might also be able to suggest the possibility of kickstarting a growth cycle with wash trading, but these newly emerging projects also do have a fairly low suspected wash trading volume.
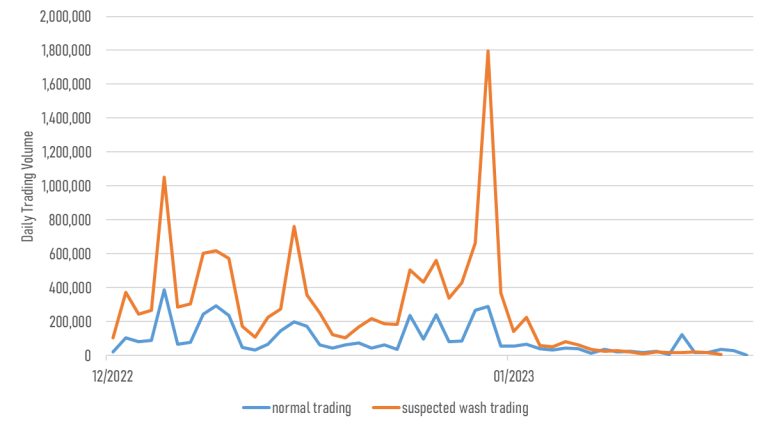
Nonetheless, there is the one and only exception to the above cases: Collection X.
Figure 14 – The Trading Volume Time Series of Collection X
There are many collections that have a higher suspected wash trading volume than normal trading volume, and according to 4.1., most of the activities are rooted from the motivation of acquiring token incentives. We also exemplified Meebits that >99% of its suspected wash trades were done at incentivized marketplaces.
However, Collection X is the only collection that shows an entirely different color.
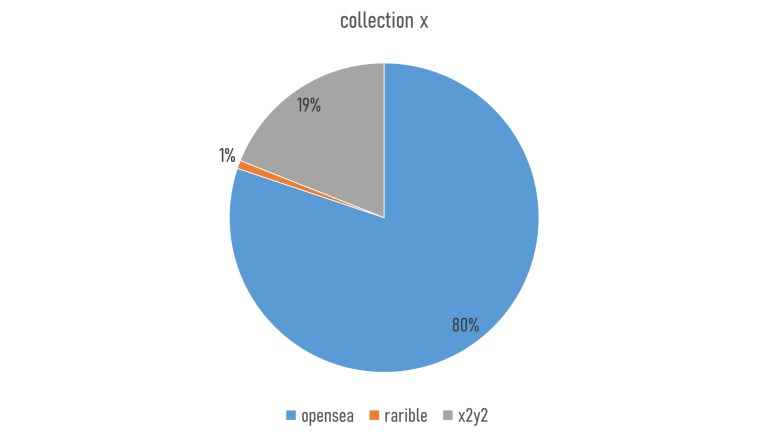
Figure 15 – The Suspected Wash Trading of Collection X by Exchange
Astoundingly, most of suspected wash trades are occurring at Opensea for Collection X. Even the aggregator Blur occupies <30% of the total suspected volume. We cannot identify who is behind the activities, but if Collection X succeeds in the long run, it might be the first project (possibly) succeeding from suspected wash trading to boost the growth.
4.4. Case Studies
In this section, we sampled a few notable wash trading cases just to give a clearer picture.
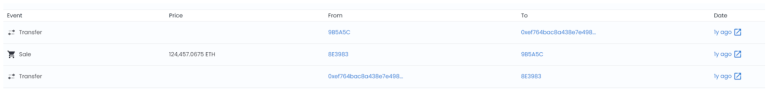
Figure 16 – Cryptopunk #9998 Sales History
Source : OpenSea
Cryptopunk #9998 was transferred from 0xef76 to 8E3983, was soled from 8E3983 to 9B5A5C at 124K ETH which was approximately equivalent to $500M, the record high sales price in the NFT history. Right after the sales, Cryptopunk #9998 was sent back to the original holder, 0xef76.
This was undoubtedly a very suspicious wash trading behavior, but the intention is unclear. 124K ETH used for the sale was funded through a flash loan, and the suspected wash trader did not earn any explicit profits.
We reckon the trade was simply done to set the world record for a single NFT item trade.
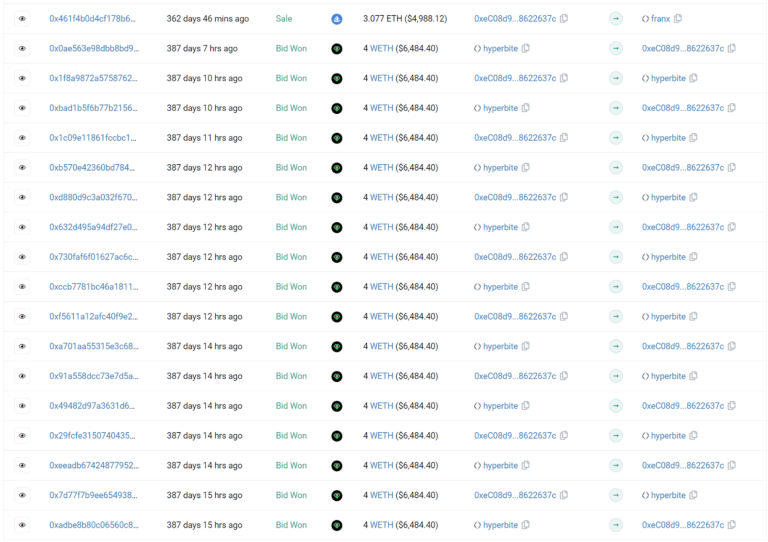
Next, we have a Meebits transaction history to illustrate a usual suspected wash trading.
Figure 17 – Meebits #17021 Sales History
Source : Etherscan
Figure 17 shows straightforward back-and-forth trades between hyperbite and 0xeC08, carried out on Looksrare at 4 WETH price consecutively. This is one of the common shapes of suspected wash trading behavior.
5. Key Takeaways and Concluding Remarks
NFT markets intrigue many Web2 conglomerates, and also Web3 startups due to their possibilities and ambiguity. However, it is important to correctly view the market before making business decisions.
The current NFT industry appears to be greatly overexaggerated in terms of demand that over 56% of the total trading volume in 2022 was done for token incentives and other intentions apart from genuine investment or flip trading.
Moreover, we lack grounds for whether performing wash trading is beneficial to projects or not (disregarding the regulatory and ethical concerns). Wash trading could bring short-term intraday hypes, but they are not longlasting.
We must consider all the factors that could distort business conditions. When reviewing Total Addressable Market, a $19B trading volume market might suffice, but after adjusting for suspected wash trades, the market shrinks to $8B. Is the $8B market still enough for the business? Perhaps no, and projects might need to onboard Web2 normies to their NFT products to scale.
One deliberate limitation to our study is the limited sample size, as we narrowed down our sample size to top 27 collections in terms of trading volume. However, we still believe that our sample is still representative of the whole NFT market despite their scarcity as they are the ones that first neologized “NFT Blue Chips” and still constitutes the most of market cap and trading volume in the NFT industry.
6. Appendix
6.1. Data Aggregation
We selected 25 Ethereum NFT collections by all-time trading volume, 3 additional Ethereum collections by trading volume after Dec 2022. Additionally 2 NFT projects were added to the database for cross-checks against academic papers.
We also picked 2 Solana NFT collections by all-time trading volume.
We gathered all transactions involving the above sample NFT collections, including sales and simple transfers. However, when we were gathering the data, we only included single item trades (one seller, one buyer, one NFT in one block) and excluded batch trades (multiple sellers, multiple buyers, multiple NFTs in one block) because matching the trades in the latter is extremely computational heavy.
We also aggregated the first deposit transactions from all the accounts related to the NFT collections mentioned above.
6.2. Data Processing
Each dataset had the following data columns: Block number, Timestamp, Transaction hash, NFT address, Token ID, Sender, Receiver, Sales price (Sales), Token address of the sales price (Sales), Contract address (Sales).
Logic 1 : Circular Transfer & Sales Activity
To apply for Logic 1, we built directed graphs for each unique Token ID (ex. Azuki #1) to detect cycles. We applied the DFS algorithm to search for each node to identify loops.
Figure 18 – An Example of a Directed Graph with a Loop
In Figure 18, a DFS algorithm would work in the following steps:
1) Starts from Node 1 2) Follows an arrow to Node 2, and records Node 2 as visited 3) Follows an arrow to Node 3, and records Node 3 as visited 4) Follows an arrow to Node 4, and records Node 4 as visited 5) Follows an arrow to Node 2, finds a loop as Node 2 is already recorded as visited 4) Follows an arrow to Node 5, and records Node 5 as visited 5) There is no more arrow at Node 5, ends the search, and returns to Node 1 6) Follows an arrow to Node 6, and records Node 6 as visited 7) There is no more arrow at Node 6, ends the search, and returns to Node 1 8) All arrows from Node 1 are visited, and so do for Node 2 to 6, exits the search
Using the transaction from Sender to Receiver, we build the directed graphs as in Figure 18 for all NFTs, and mark all nodes in a cycle with a Boolean variable ‘Cycle.’
For a practical implementation, we used Python to build a directed graph and to run a DFS algorithm.
Logic 2 : Common Funder
To identify the common funders, we simply matched all accounts in Sender and Receiver data columns from the deposit address database, and checked for the equality of the outcomes.
Logic 3 : No Price Movement
We subsetted the sales history from the transaction history, and checked for each item in the sales history on their differences in time and differences in price based on our criteria of 12-hour timeframe and 5% volatility.
6.3. References
1. Wachter et al., NFT Wash Trading: Quantifying suspicious behaviour in NFT markets, Arxiv, Available at:https://arxiv.org/pdf/2202.03866.pdf (Accessed: February 13, 2023)
2. Morgia et al., NFT Wash Trading in the Ethereum Blockchain, Arxiv, Available at:https://arxiv.org/pdf/2212.01225.pdf (Accessed: February 13, 2023)
3. Cho et al.,. Non-fungible token transactions: data and challenges, Arxiv, Available at:https://arxiv.org/pdf/2210.07393.pdf (Accessed: February 13, 2023)