This content is provided for informational and educational purposes only, and should not be relied upon as legal, business, investment, or tax advice. Furthermore, references to any securities or digital assets are for illustrative purposes only and do not constitute an investment recommendation or offer to provide investment advisory services. Factomind cannot be responsible for your use of the information provided in this content. Factomind has established, maintained, and enforced strict internal policies and procedures designed to identify and effectively manage conflicts of interest related to its business activities. Factomind does not own any digital assets mentioned below, nor has it made any purchases or sales of the digital assets mentioned below. All materials in this research paper are sourced from publicly available information.
1. Introduction
Blur, a newly launched NFT marketplace, has quickly become the primary focus of the Web3 market with its airdrop scheme of its governance token $BLUR. Essentially an aggregator, Blur gained its fame initially from its neat interface particularly designed for active traders. It was also known widely for mystery boxes, which were distributed in conjunction with its launch.
Blur gamified the airdrop by obscuring the exact amount and formula for token distribution, instead opting for ‘multipliers’ and ‘lootboxes’ familiar to anyone who has played mobile games. The more Alice trades, the more Alice will receive in airdrops. A simple mechanism executed in a fine way.
Thus far, there have been two ways of receiving $BLUR released to the public; One, trade NFTs within six months from Blur’s launch in Oct. Two, trade NFTs on Blur after the launch.
We all witnessed overnight thousandaires being produced en masse, ranging from 80,000 $BLUR to 3M $BLUR. What could be the driving factors of those recipients that streamlined their gains? This paper is a brief overview of the airdrop incident, or “how did they get so much $BLUR?”
Another question we would like to address in this publication is the post-mortem on the $BLUR airdrop. Did the airdrop achieve the intended results? What were the behaviors of the airdrop recipients? If curious, this paper is for you.
2. Data Specification
All our data in this paper is from the Ethereum blockchain. We collected transaction data on $BLUR tokens, which counted 100K transactions at the time of scraping. Also, we collected transaction data of the addresses that received the airdrop.
We identified a single contract address sending $BLUR tokens to 40K+ addresses as the airdrop event, and analyzed the characteristics of the recipients.
We also used 350K NFT trading events from the sample addresses. The sampling method is described in Section 3.
One limitation of our dataset is that we did not incorporate NFTs traded in a batch, or multiple NFTs traded between multiple addresses in a single block for trading volume, as it was difficult to identify exactly how much fund was moved from which wallet to another.
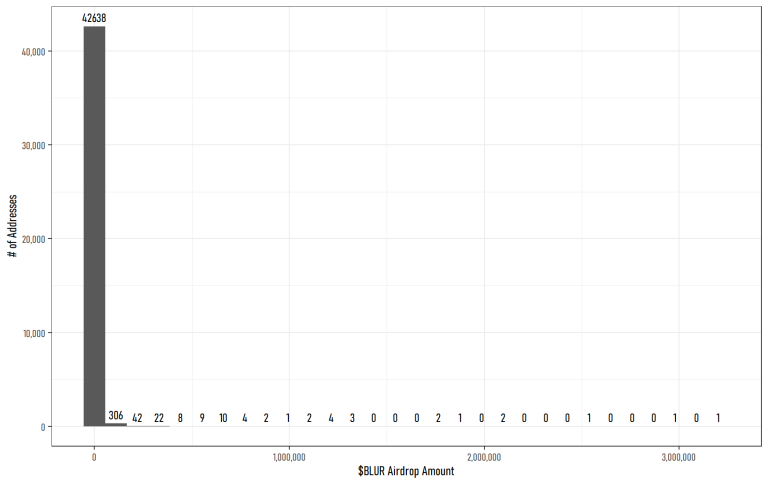
Figure 1 – $BLUR Airdrop Distribution
The majority of the recipients received <50,000 $BLUR tokens, yet the overall distribution is skewed to the right with few qualifiers obtaining 1M+ tokens.
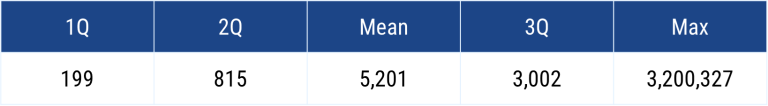
Table 1 – Summary Statistics of $BLUR Recipients
3. The Winning Behavior
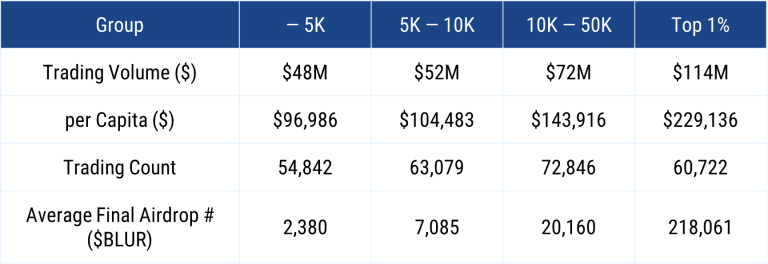
We sampled a total of 4 groups for the analysis: The top 1% recipients in amount (432 addresses), samples from the 10K to 50K group (500 addresses), samples from the 5K to 10K group (500 addresses), and finally samples from the 5K under group (500 addresses). For clarification, the Top 1% threshold is 54K $BLUR.
As we explained above, the airdrop amount is pertaining to two actions: Prior trading activity and trading activity on Blur.
The average final airdrop amounts per group are 218K $BLUR, 20K $BLUR, 7K $BLUR and 2K $BLUR, respectively in a descending order.
First, we will examine the former factor.
3.1. Factor 1: Prior Trading Activity
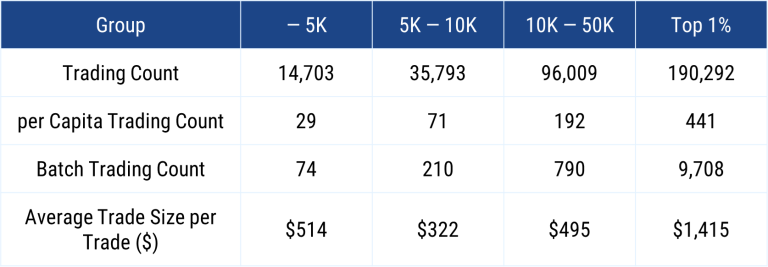
Table 2 – Trading Activity on OpenSea by Group (Apr 22 – Oct 22)
*Batch trades excluded
Our first hypothesis is that the final airdrop amount is highly dependent on the retroactive airdrops to trading activities prior to the Blur launch. In Table 2, we can easily observe that the NFT trading activities increase with the Group variable.
Nonetheless, whereas the final airdrop amount for the Top 1% group is thirty times more than the amount for the 5K to 10K group, yet the trading volume per capita differs only marginally by twofold. Based on this evidence, we may safely assume that prior trading activities on other exchanges were not the determining factor for the $BLUR airdrop.
3.2. Factor 2: Blur Trading Activity
With the first hypothesis rejected, our next hypothesis is that trading activity on Blur determines the final airdrop amount.
Before we start, it is important to note that there are several ways to earn points for the $BLUR airdrop: One, actually trading using Blur, and two, listing and bidding for NFTs. However, we will exclude the second method–listings and biddings that were not fulfilled–from the scope of this paper since bidding activities are handled off-chain.
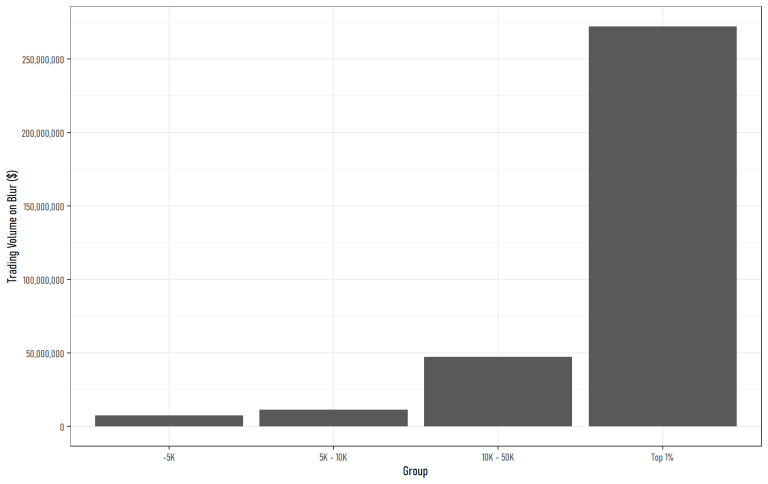
Figure 2 – Trading Volume on Blur by Group
*Batch trades excluded
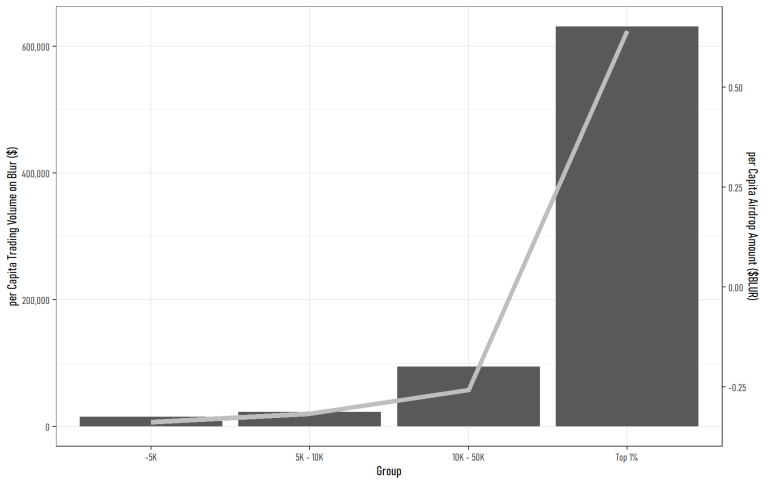
As expected, Blur usage appears to explain most of the variations in the airdrop amount. For a more intuitive comparison, we will map per capita trading volume and overlay airdrop amount in Figure 3.
Figure 3 – per Capita Trading Volume (LHS) and Airdrop Amount (RHS)
*Batch trades excluded
Of course, along with the trading volume, trading counts also grow exponentially.
Another noticeable trait is the proportion of batch trades to single item trades among the groups. As we climb up the ladder, recipients execute batch trades much more frequently than the lower brackets.
Table 2 illustrates the above characteristics.
Table 3 – Trading Count on Blur by Group
A counterintuitive property emerges here; the average trade size was not actually an important independent variable for airdrops; the frequency was of higher importance, as represented by the higher trade size from the sub-5K group.
Some Other Fun Statistics
The top 1% group spent roughly $50K in fees (marketplace + royalty + transaction fees), whereas the 5K to 10K group spent around $3K.
In our sample data of 350K NFT trades, 75% of total trades were small-sized trades below $700.
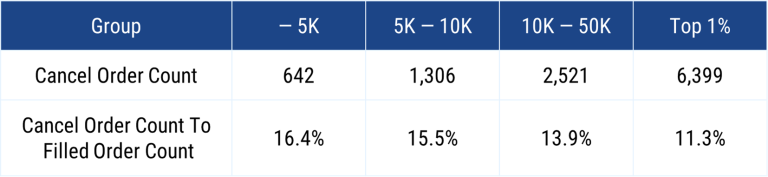
For non-trading points (such as listings and biddings not filled), we could use ‘Cancel’ transactions as a very crude proxy to measure the frequency of the behavior.
Table 4 – Cancel Order Frequency by Group
3.3. A Deep Dive into Blur
We scraped the surface till 3.2., so let’s dig deeper into the $BLUR airdrop recipients.
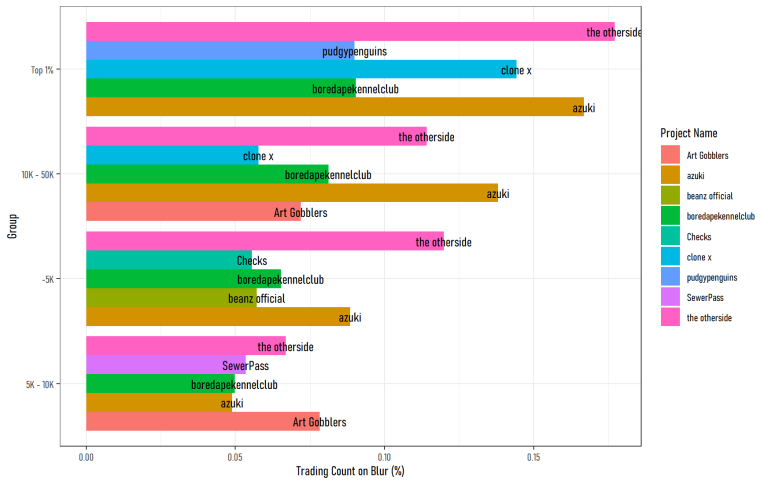
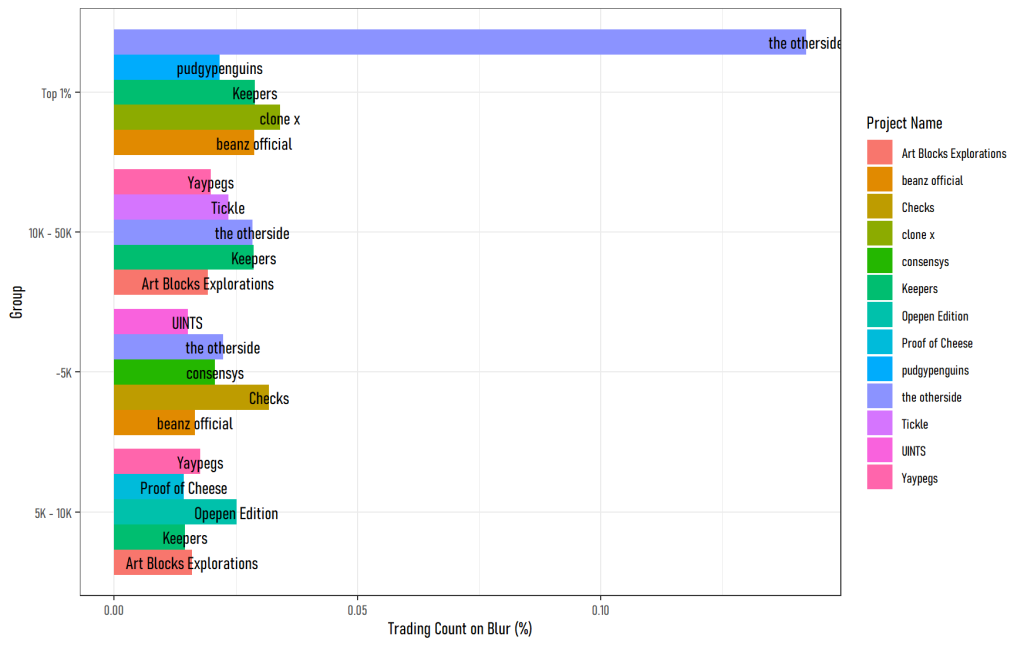
Figure 4 – Trading Volume of Top 5 Traded Collection by Group
Figure 5 – Trading Count of Top 5 Traded Collection by Group
From Figure 4 and 5, we can easily deduce that merely inflating trading volume with obscure collections were not popular (or not working) as Blur prioritized collections with a high trading volume.
However, the above characteristics do not guarantee the existence of only genuine trading activities; we picked a few top trending collections and all their transactions including sales and transfers, built directed graphs for each NFT token, and applied a DFS algorithm to detect any suspicious trades regarding wash trading.
The result was quite intriguing.
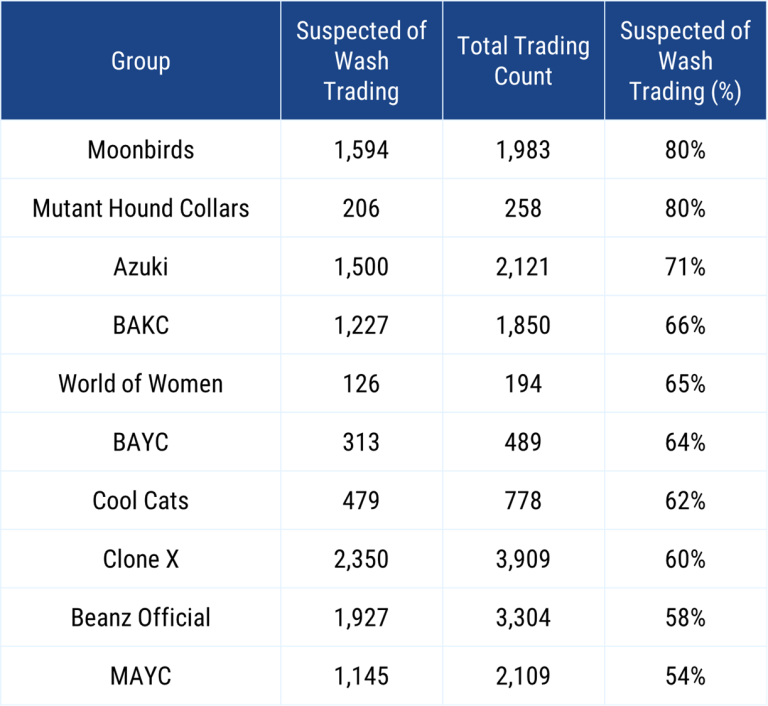
Table 5 – Suspicious Trading Activities per Collection from Top 1% Group
From the top 1% Group, more than half of the most Blue Chip trades were suspected of wash trading. Moreover, the ratio of suspected wash trading falls as the amount of $BLUR drops.
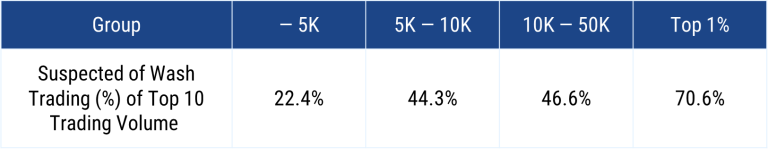
Table 6 – Suspicious Trading Activities per Collection by Group
It might be uncomfortable, yet it appears to be a significant portion of suspected wash trades was done to qualify for the airdrop.