Unveiling the True Scale of the Ethereum DeFi Market
Table of Contents
Important Disclaimer
1. Introduction
We have witnessed thousands of blockchains and dApps that proclaimed to onboard the next wave vanish, and after all this time everyone still calls for ‘mass adoption.’ How far are we on the adoption meter, and how large of an audience are we selling into? How large of a user base are we supposed to accumulate in order to be a top DeFi contender?
Especially with all these DeFi projects popping up ever since 2020, we wonder if the market allows how many projects to proliferate, or justifies the valuation for a single project–Uniswap. In this paper, we will quantify the demand side of on-chain finance and size the market.
Simple addresses could be a crude proxy to the actual demand, but it would be vastly inaccurate considering the amount of MEV bots parasitic (both in good ways and in bad ways) to organic users. We will introduce the concept of derived demand, which is existent if and only if the primitive demands are present, and filter out the derived demands to gauge the true size of the primitive demands, or the actual users of DeFi protocols.
2. Data Specification
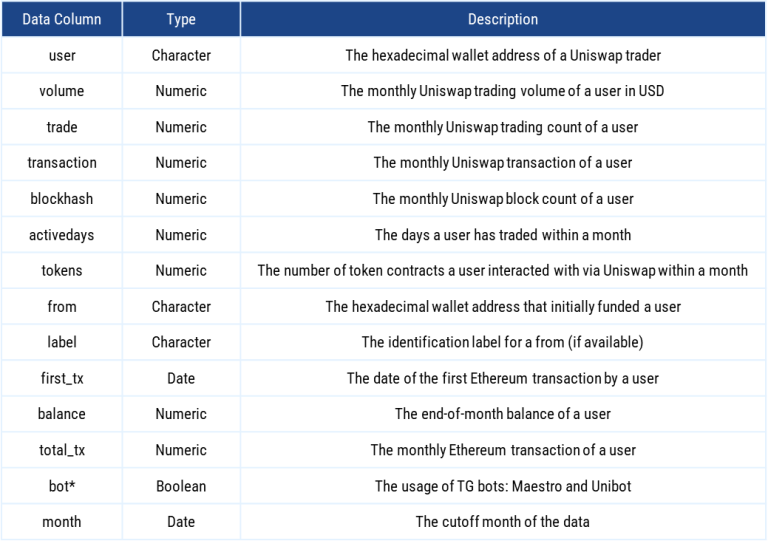
Table 1 – Data Description
*Note that Boolean bot is different from the MEV category below. For a matter of fact, “bot” in this sense is classified as Core Primitive users, or true organic users of Uniswap.
3. Model
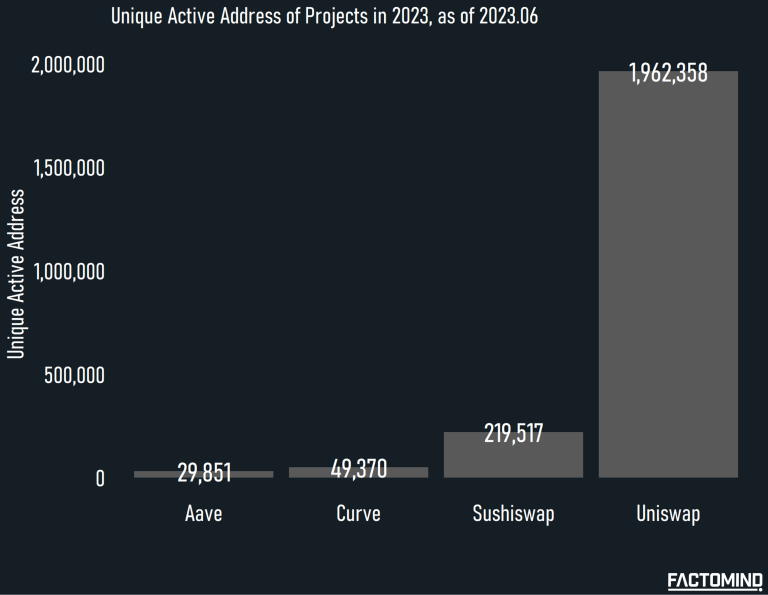
Figure 1 – Unique Active Address of Projects in 2023, as of 2023.06
3.1. Hypotheses
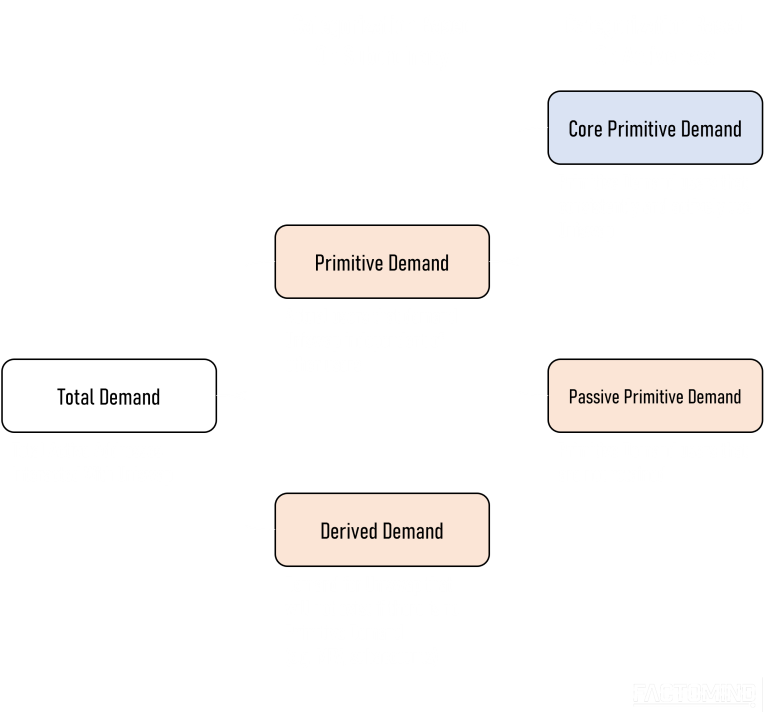
Figure 2 – On-chain Finance Demand Categorization For Uniswap
Total Demand is the total addresses that interacted with Uniswap.
Primitive Demand is the actual users that organically and independently demand Uniswap irrelevant of other users.
Derived Demand is the demand for Uniswap that only exists when Primitive Demand exists. MEV Bots and subaccounts belong to this category.
Core (Primitive) Demand represents the active, retained users of Uniswap, and thus will be our core target for filtering.
Dormant (Primitive) Demand is the demand, although Primitive, that is not retained or barely makes transactions on Uniswap.
Our core goal is to filter our other noises to gauge the true size of Core Primitive Demand. Do note that we are not verifying whether there are real humans sitting behind Core Primitive Demand accounts; for example, an actively trading Unibot account will be categorized as Core Primitive as somebody is deploying a bot to demand Uniswap, which is an actual demand (whether they are for sniping, flipping, or buy and hold).
However, MEV bots only trade if and only if Core Primitive Demand accounts trade, thus they are classified as Derived Demand.
3.2. Filtering Methodology
We utilized 4 distinct logics to filter out Derived Demand and Dormant (Primitive) Demand. Note that all data are from Uniswap.
Filters for Derived Demand
- MEV Filter : Transaction Count to Block Count > 1.1 OR Transaction Count in Top 0.5% percentile
We introduced the above condition to MEV bots that push more than one transactions within a single block for arbitrage or sandwich attacks - Subaccount Filter : Funded from the same non-CEX or non-smart contract wallets
A self-explanatory condition to filter out subaccounts; we labeled the Subaccount filtered wallets with the highest activity as Primitive
Filters for Dormant (Primitive) Demand
- Being active for at least 3 months in a 6 month lookback (or >50% of the months for accounts with less than 6 months age) AND
- More than 3 Swap transactions in each of the active months
4. Chasing the Uniswap – Data Overview
Our findings suggest that although the monthly active addresses for Uniswap hovers above 600K, the Primitive Core Demand–or actual users demanding Uniswap–is much less at 40K for a moderate case and at 10K for a conservative case.
A moderate case of 40K is the direct result of applying the filtering methods described in 3.1.
A conservative case of 10K is applying the duplicated ratio of 20% from Subaccount Filter to CEX funded wallets as well, under the unlikely assumption that CEX funded wallets are also flooded with subaccounts.
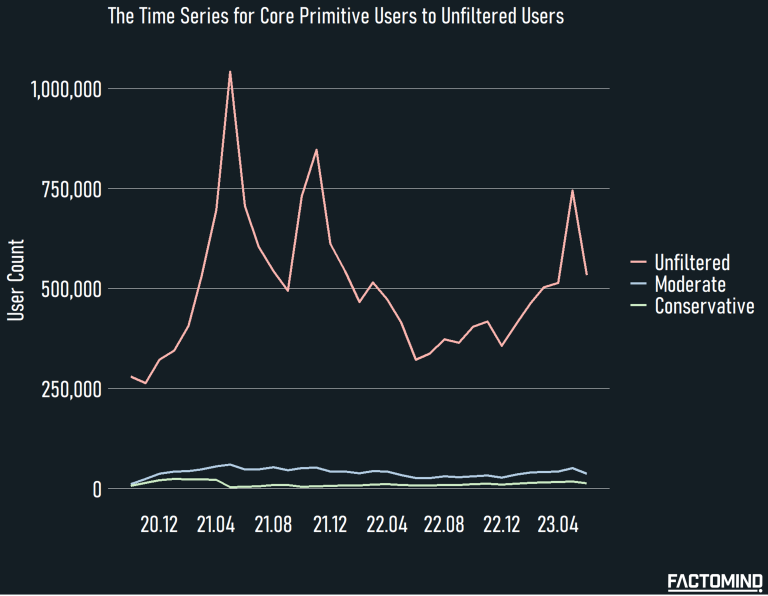
Figure 3 – The Time Series for Core Primitive Users to Unfiltered Users on Uniswap
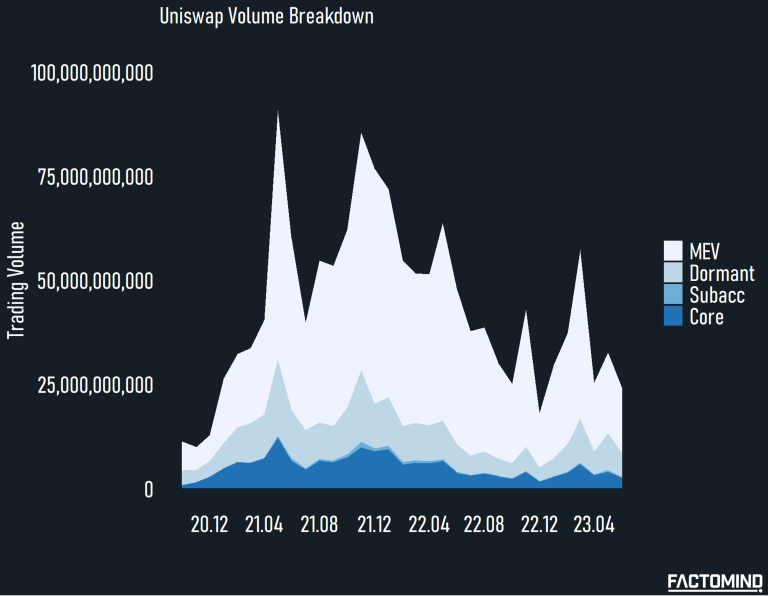
Figure 4 – Uniswap Volume User Category Breakdown
*Trading volume hereunder is denoted in dollar terms.
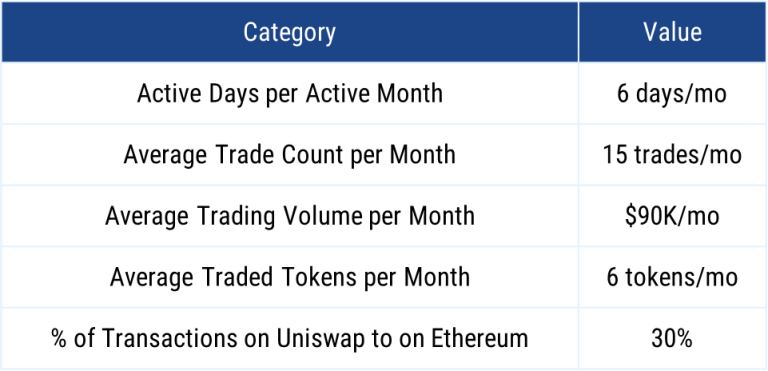
Table 2 – User Category Summary
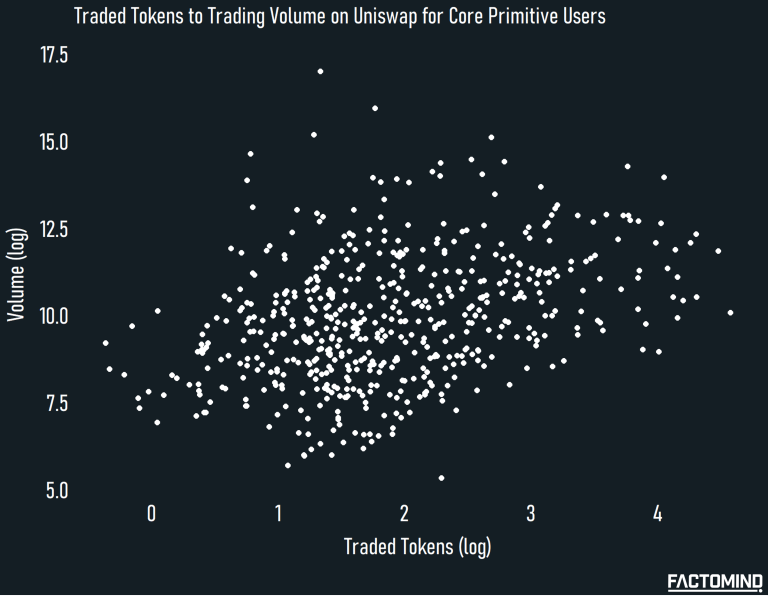
Figure 5 – Monthly Average Traded Tokens to Trading Volume on Uniswap per Core Primitive User
5. Chasing the Uniswap – Stylized Facts
5.1. A Ghost Town for DeFi
Less than 10% of the current active addresses on Uniswap are Core Primitive users, making the monthly active DeFi user estimate between 10K and 40K.
The majority of the wallets are Dormant (Primitive) users, which are created, send a few transactions, and then disappear.
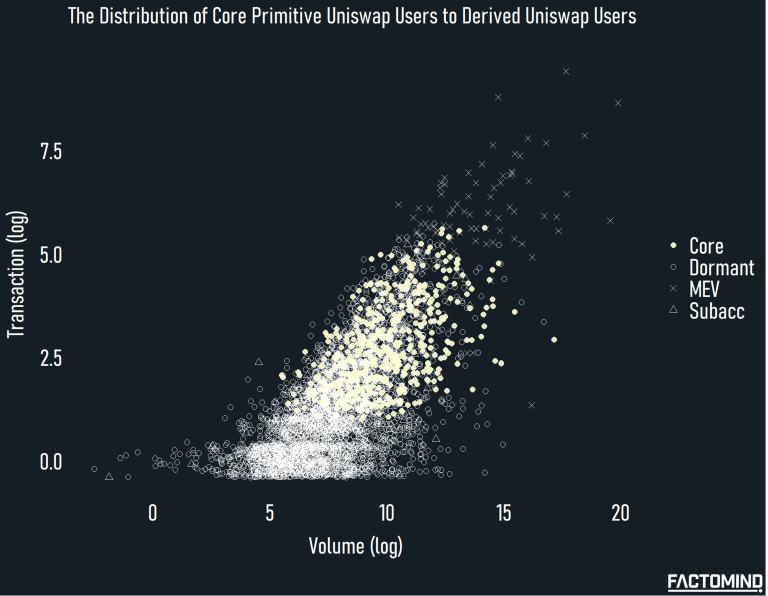
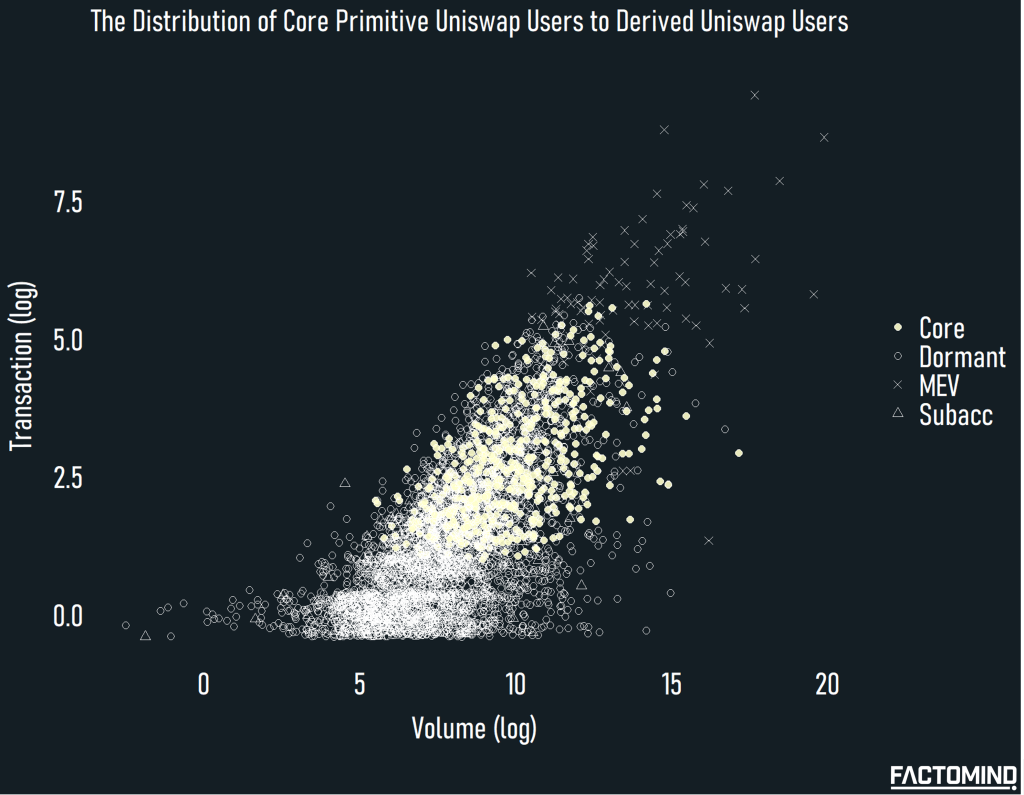
Figure 6 – The Distribution of Core Primitive Users to Derived Uniswap Users
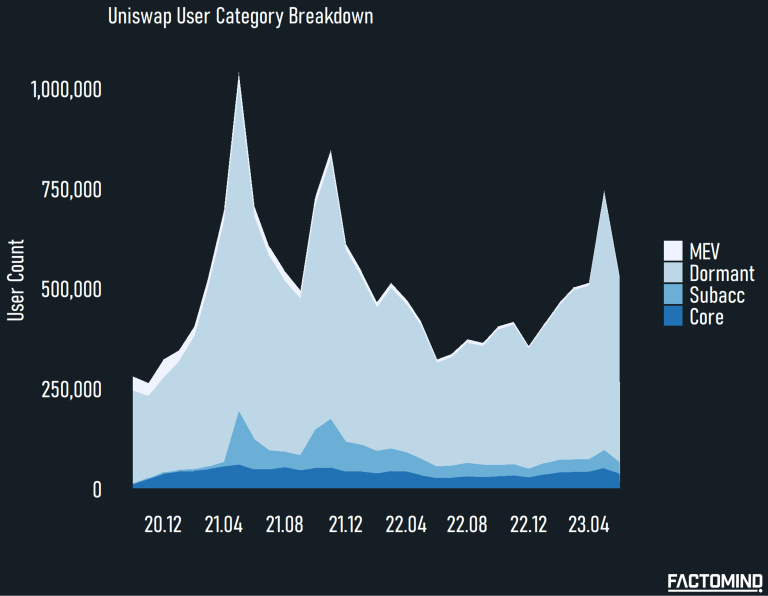
Figure 7 – Uniswap User Category Breakdown
If we look at the overall time frame, we can easily notice that the majority of upticks in Uniswap users is attributable to inflows of subaccounts and Dormant users (non-retained flash users). An interpretation could be that the booming cycles in the Web3 industry entice new users enough to try on-chain finance, yet the utility is insufficient to keep them around.
5.2. To Whom Your Token Sells
CEX listings are sometimes notorious for producing ‘selling pressure,’ yet without CEX listings, projects are basically selling their tokens into a 6K people market.
Among the 40K monthly Core Primitive Uniswap users as of 2023, only 6,474 users actively trade Small Cap* tokens. Considering the $RLB holders and $UNIBOT holders amount to ~3K after the recent surge, we believe our estimates are reasonable as these two projects are not listed in any major exchanges as of writing.
*For simplicity, we assumed the Core Primitive Uniswap users who interacted with 10+ token contracts to be Small Cap traders
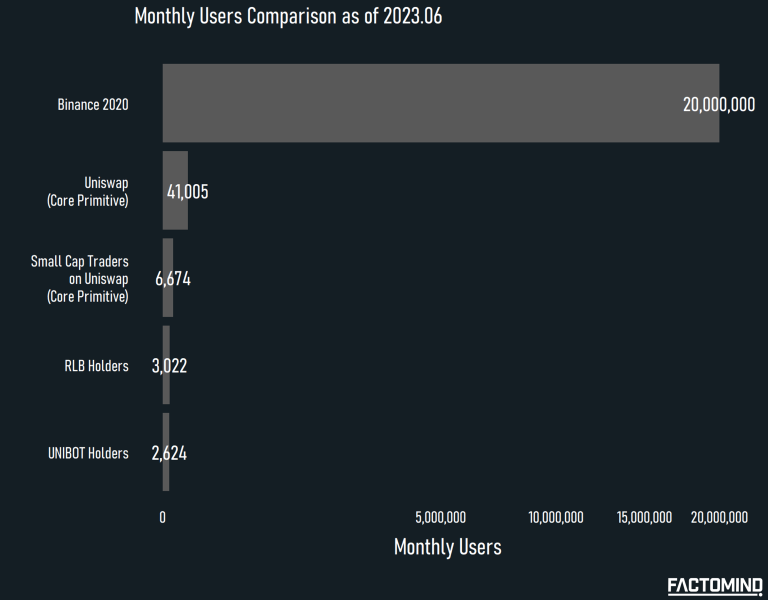
Figure 8 – Monthly Core Primitive Users Comparison
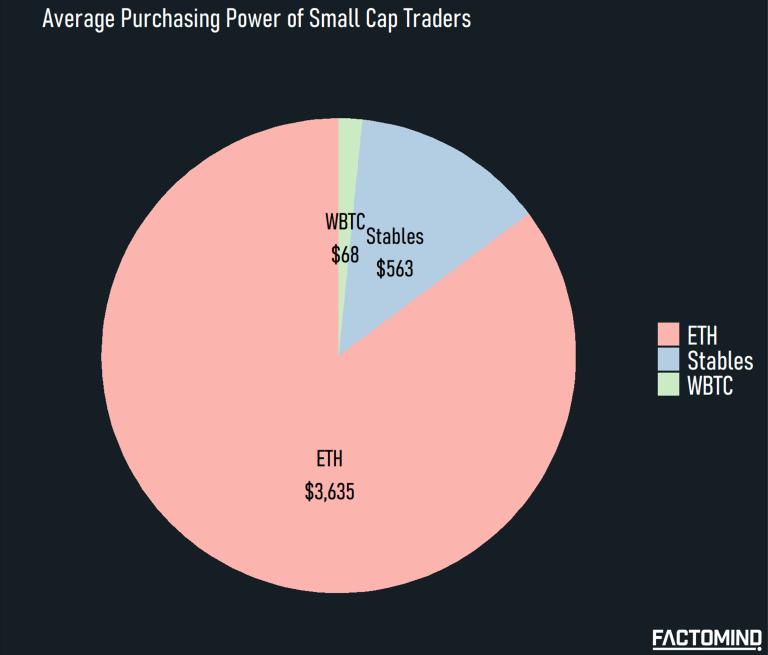
Figure 9 – Purchasing Power of Small Cap Traders on Uniswap
5.3. No Market for Young Men (Once You Go Bull, You Never Go Dull)
Median account age for Core users in 2023 is 600 days, while the median account age for Dormant users is 200 days, suggesting that the retained, active users are the old users who used Uniswap since 2021, while newcomers try out Uniswap once or twice then leave.
It is a finding that coincides with 5.1. A Ghost Town in DeFi.
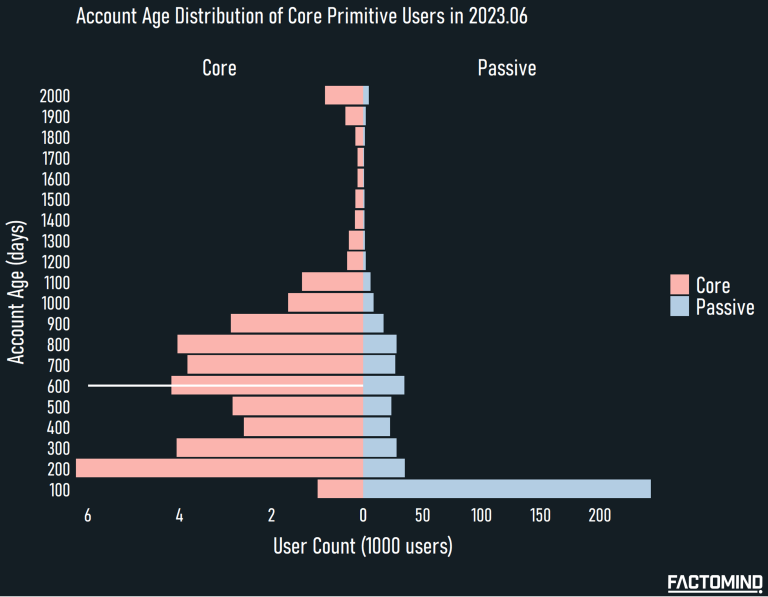
Figure 10 – Account Age Distribution of Core Primitive Users in 2023.06
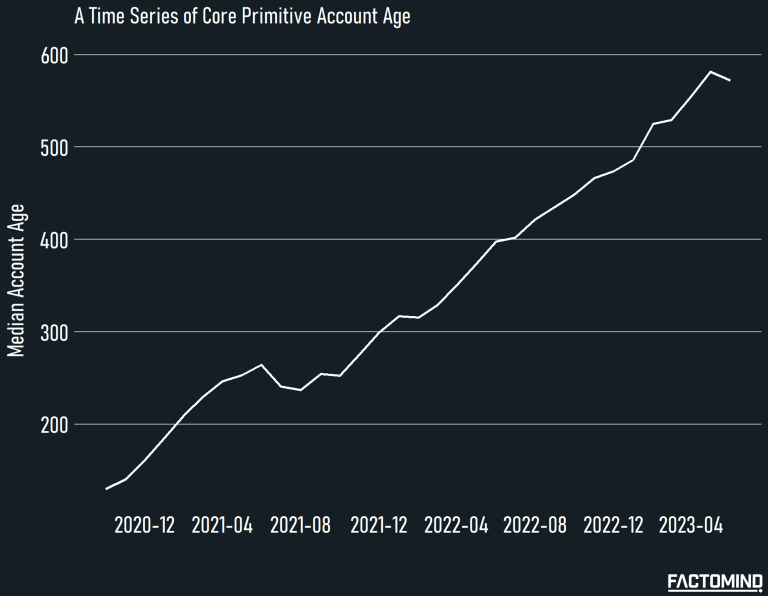
Figure 11 – A Time Series for Core Primitive Account Age
5.4. Time Can’t Break Bonds But It Can Break Funds
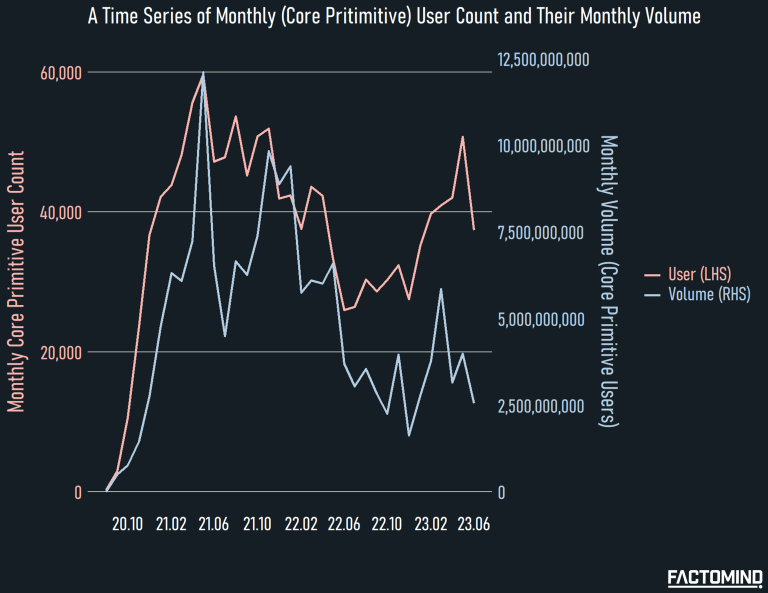
Figure 12 – A Time Series for Monthly User Count and Monthly Volume
5.5. Ride the Tide of Bullish Pride
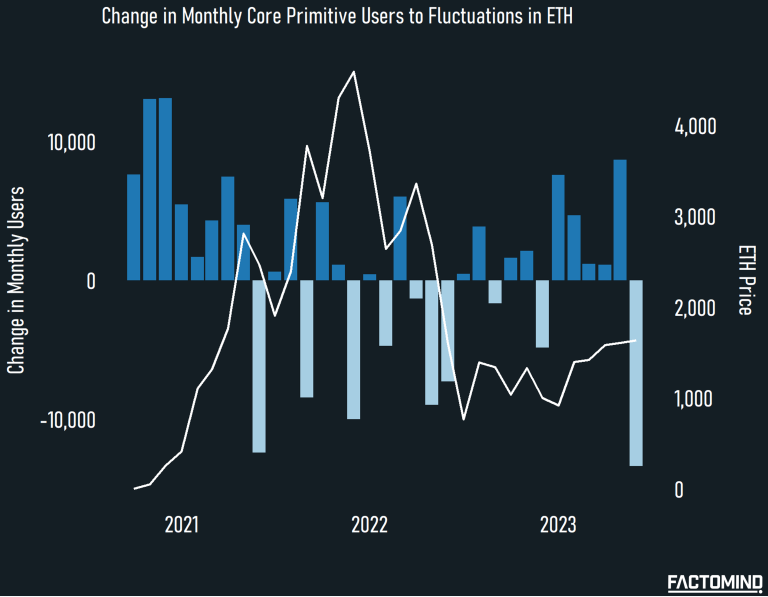
Figure 13 – Change in Monthly Core Primitive Users to Fluctuations in ETH
5.6. Options Galore in a Meme Lore

Figure 14 – Average Tokens Traded by Core Primitive Users
5.7. ENS : Evidently Not Swapping
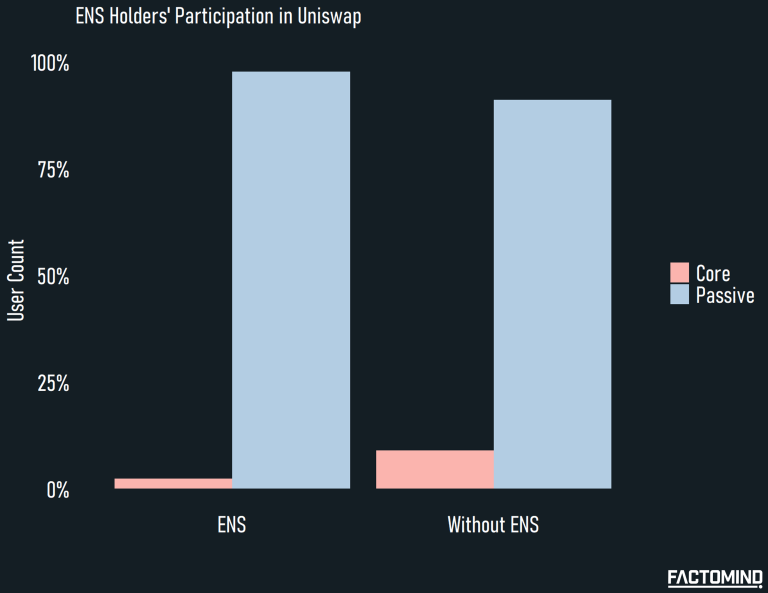
Figure 15 – ENS Holders’ Participation in Uniswap
6. Summary and Key Takeaways
– There are 600,000 monthly unique traders (wallets) on Uniswap.
– Out of 600,000 monthly unique traders, approximately 40,000 are real, organic users (which we dubbed ‘Core’) that are not MEV bots, subaccounts, or dormant addresses.
– Out of 40,000 real, organic users, approximately 6,000 traders actively trade tokens other than $ETH and stablecoins.
– We are essentially selling our business into these 6,000 small cap traders for on-chain finance projects, unless we go for CEXes for a better reach.
- 1) This is not an absurd number that requires tremendous funding in marketing, the number is within reach with a decent product paired with a decent strategy.
- 2) With only 6,000 active participants on the on-chain finance market, we still have much room to grow.
