The Harsh Truth, NFT Wash Trading - Part 1 of 2
Table of Contents
Part 1
Part 2
Important Disclaimer
1. Introduction
So far our paper series revolved around the fungible universe, covering topics ranging from community building to business goal setting. There is the other asset class looming in the corner, the non-fungible buddies. We have intentionally prioritized fungible tokens as they occupy the majority of the Web3 market cap and are more actively traded. Yet, we have never neglected NFTs, and from now on we will release a paper series dedicated to the NFT market.
All our Thematic Research Series share one core theme—we share insights derived from market data. Before extracting meaningful insights from data, we must refine it to remove the impact of distortions, so that we draw a clear, undistorted picture of the market. Often, as we filter the dataset, we discover new market perspectives which were unavailable before.
One of the prevalent, yet serious market challenges is wash trading behavior. Wash trading in the fungible market (and also in the TradFi market) is done to spread misleading information to other market participants, particularly about the attractiveness of a project’s token. Failure to adjust for such a faulty intelligence results in a critical error to anyone participating in the market. Thus, we filter our database for market distortions to provide an accurate representation of the market status.
In the NFT market, filtering data for wash trading is even more important than in fungibles due to two core reasons. One, all NFTs possess unique Token IDs, allowing us for token-based analyses, whereas for fungible ones, only account-based analyses are allowed. Two, NFT markets are much more vulnerable to market anomalies due to illiquidity.
For our first part of our NFT series, we prepared an inclusive paper on NFT wash trading—how and why do traders use wash trading, and what are the expected consequences? Spoiler alert, the current NFT market is greatly overestimated.
2. Data Specification
2.1. Data Collection
We collected transaction data on 32 NFT collections on Ethereum blockchain (ERC-721) and Solana blockchain (Solana Token Standard), with 27 used for the wash trading analysis, 3 for studying trading behavior of the emerging NFT projects, 2 for cross-checking our filtering logic against other academic papers.
These 32 collections were chosen based on their trading volume.
Our final dataset consisted of 1M sales and 2M transactions across 32 NFT collections.
2.2. Research Methodology
Logic 1 : Circular Transfer & Sales Activity
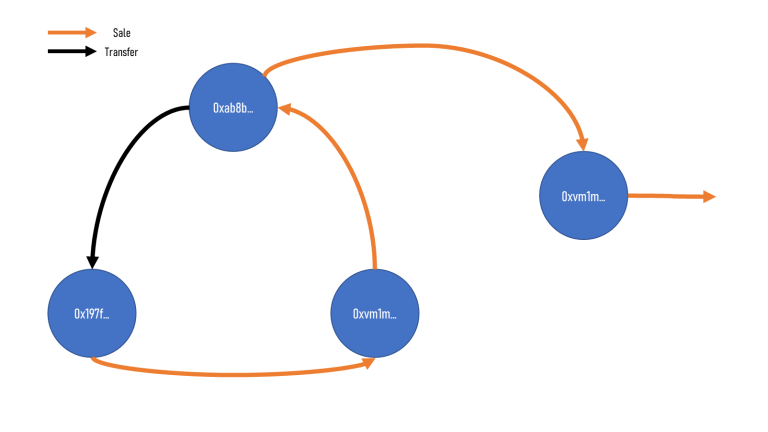
Figure 1 – Transaction Graph for Logic 1
Logic 2 : Common Funder
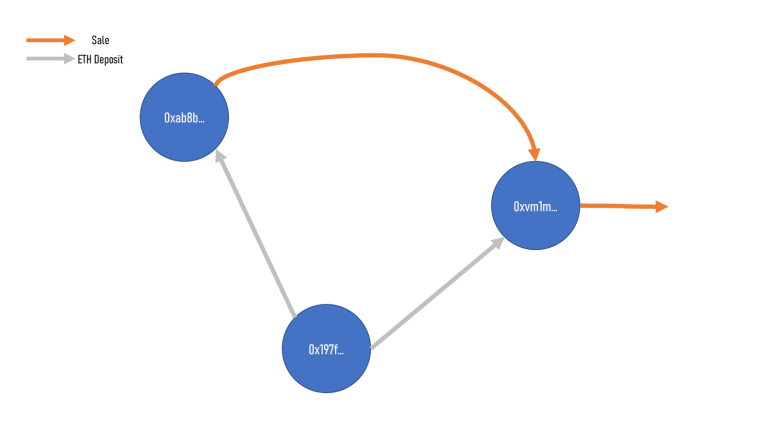
Figure 2 – Transaction Graph for Logic 2
We also filtered for the common funder trait. We tracked transaction history of each account involved in Figure 1, and checked for the senders of their initial ETH deposit transactions. If two accounts involved in a sale activity are funded from the same account, we suspect that wash trading exists.
Note that we excluded CEX hot wallets in deciding the common funder trait, as we cannot distinguish the identity of the funder.
Logic 3 : No Price Movement
Inspired by Wachter et al, 2022, we filtered for consecutive sales activities that 1) happened within a short period of time and 2) were done without moving the price. To be more specific, we filtered for consecutive sales activities that took place within 12 hours from the previous sale and were traded within 5% price difference from the previous sale price.
To provide a justification for Logic 3, all NFT sales are currently posted in limit order style, so for a genuine investor that bought the NFT in anticipation of price appreciation, posting a limit sell order spontaneously at the purchase price does not make sense as it will deprive them of any profit opportunities. It is because 1) NFT marketplaces do not (or cannot) support Stop-Loss order and 2) such trading behavior will likely not even break even considering trading fees and royalty fees.
We introduced 5% price differentials to conservatively account for fees, and a 12-hour timeframe to account for investors cutting losses later in the stage.
We looked into our data to check for trading patterns, and it turned out that 23% of total NFT sales occur within 12 hours from the previous sale, 29% occur within 24 hours, and 33% within 36 hours. We deemed a 12-hour timeframe was reasonable as it had the highest increment in sales count per hour.
(Discarded) Logic 4 : Common Exit
(Discarded) Logic 5 : Delta Neutrality
(Discarded) Logic 6 : Inflated Price
3. The (Suspected) Wash Trading Status Quo
As we wrote in the introductory paragraph, we must process the data first before we draw any insights from the base dataset, and the data processing is even more important for NFTs due to their illiquidity and identifiability.
We also have practical grounds for wash trade filters. Suppose a new startup seeks to partner with an actively traded 10K PFP NFT project, but that PFPs are owned by 10 people and wash-traded with 6K wallets. Such a partnership would be worthless in any terms.
We will highlight the status quo and the intention of suspected wash trading in Section 3 and 4 respectively.
3.1. Suspected Wash Trading Activity by Marketplace
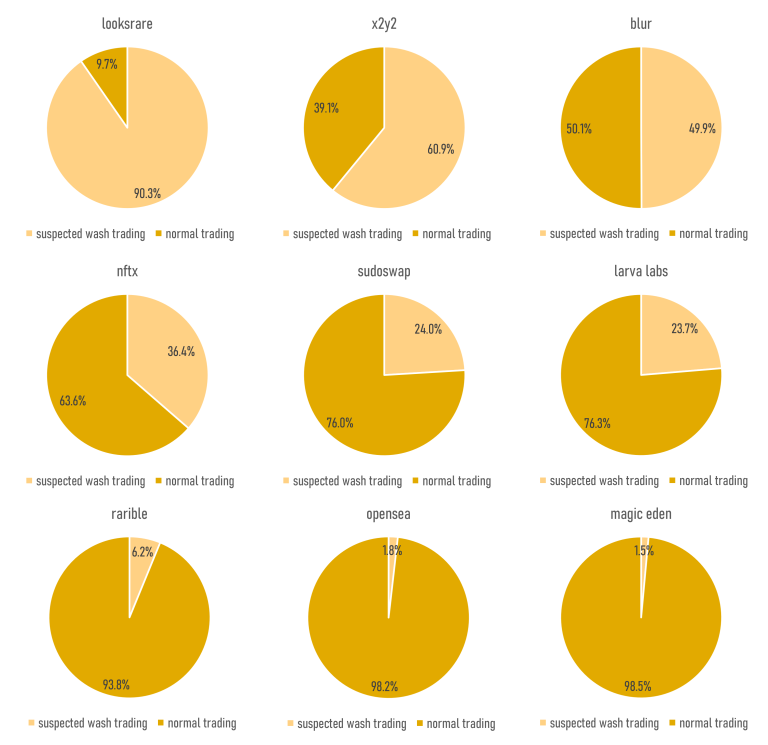
Figure 3 – The Suspected Wash Trading Volume Dominance per Marketplace
Certain NFT marketplaces definitely have 0more wash trading activities on their platforms, and we might already conjecture the reasons behind such a phenomenon, but we will save the intentions for Section 4.
Note that Figure 3 only shows the volume ratio of wash trading to normal trading, not the size of the trading volume. For example, Looksrare has only 10% normal trading activity but that 10% is much larger than most marketplaces listed in parallel.
3.2. Suspected Wash Trading Activity by Collection
Meebits secures the first spot for the most suspected of wash trading NFT collection. Usually, NFT collections have lower than 10% of wash trading volume dominance.
However, the suspected notoriety is unrelated to Yuga Labs (or Larva Labs), at least in our viewpoint. We will deal with the assertion in Section 4.
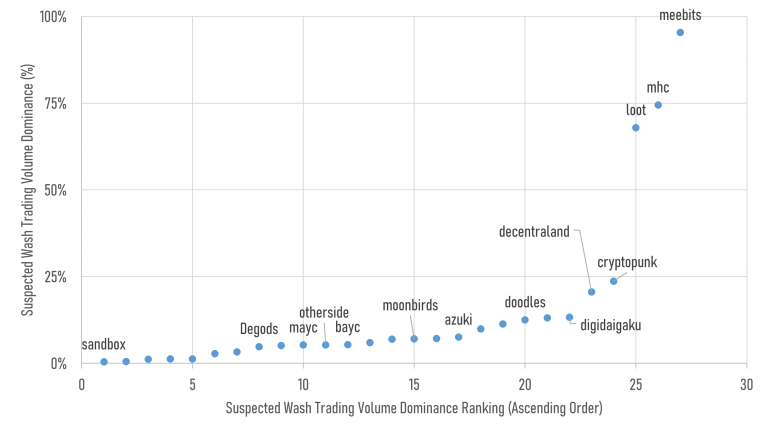
Figure 4 – The Suspected Wash Trading Volume Dominance per Collection
3.3. Suspected Wash Trading Activity Distribution
Fungible tokens are often accused of being driven by a few whales. Well, NFTs are more illiquid and more obscure, so they seem to be even more susceptible to a small minority of whales, at least regarding wash trading activities.
If we look at the distribution in Figure 5, 0.5% of wash trading activities represent 47% of wash trading volume. We can easily deduce that wash trading in NFT markets are mainly led by a small group of whales.
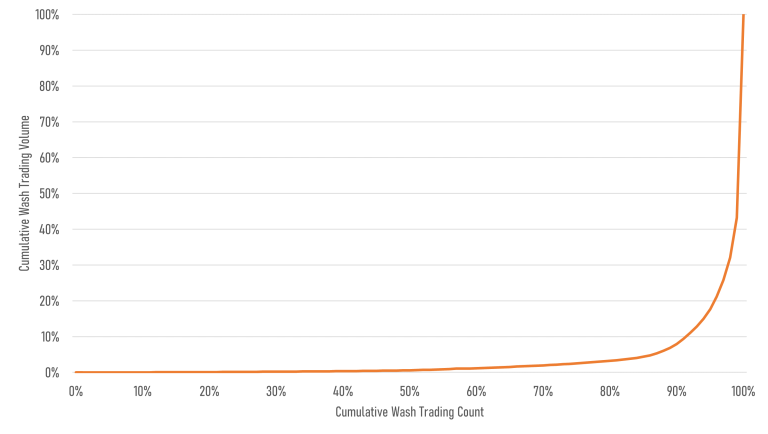
Figure 5 – The Distribution of Suspected Wash Trading Count to Wash Trading Volume
Figure 6 shows the number of wallets used in transactions identified to be involved in wash trading. Most suspected transactions include 3 to 4 wallets with back-and-forth sales.
Sometimes there are transactions with 100+ wallets involved, and these anomalies seem to be done to mask their identity by making manual tracking more difficult.
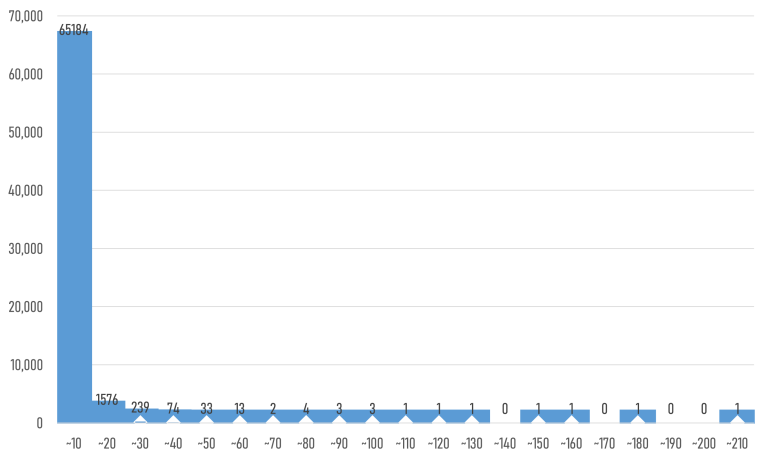
Figure 6 – The Distribution of Wallets Involved in Suspected Wash Trading Transactions
3.4. Suspected Wash Trading Activity in a Chronological Order
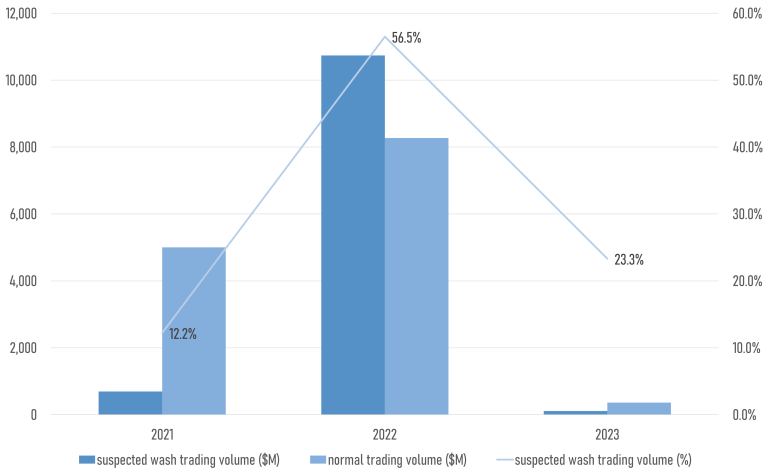
Figure 7 – Suspected Wash Trading Volume Dominance by Year
Along with the growth in total trading volume, we also had a surge of suspected wash trading activity in 2022. To emphasize, more than half of the total trading volume in 2022 was attributable to suspected wash trades. $10B of the NFT trading volume was fabricated demand that is nonexistent in the current market.
The NFT market conveys the impression of a hypergrowth with a tripling trading volume from $6B to $19B, but if we filter the suspected wash trading volume and depict the actual demand, the market only grew from $5B to $8B. 60% YoY growth might still seem decent, but considering our representative dataset mainly includes those launched in 2022 (ex. Azuki, Otherside), the actual growth rate might be even less.
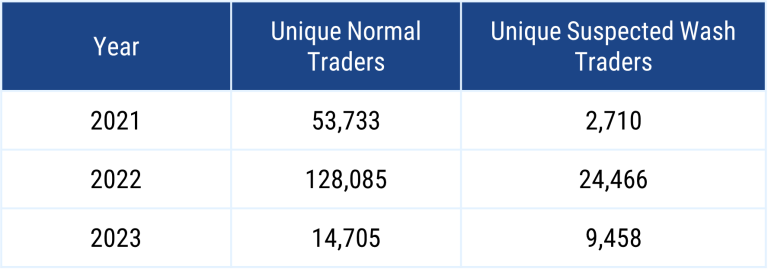
Table 1 – Unique Traders by Year, Filtered for Suspected Wash Trades
We ran a similar analysis on the wallets as well, and the result shows that there are only 130K wallets that have actively traded a top 27 NFT collection in 2022.
While we recognize that our sample size of 27 (+5) NFT collections is relatively small, their all-time trading volume occupies the majority of the total NFT trading volume, so we figured that our sample could correctly represent the market. Considering that, news press releases about monthly NFT market participants scoring over 1.1M users might be vastly inflated by fake demands as yearly genuine NFT traders for the top 27 collections are slightly below 130K.
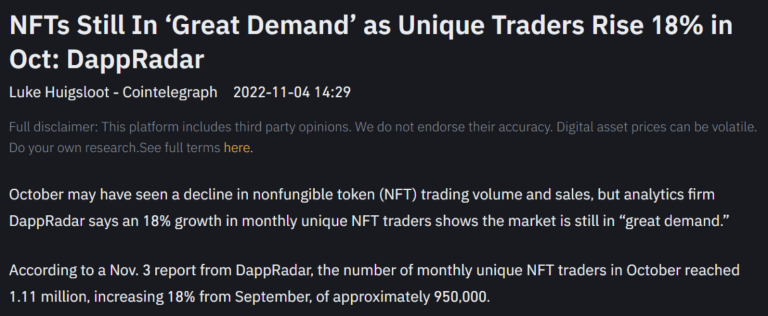
Figure 8 – An Excerpt of Cointelegraph Article on NFT Market Growth
