This content is provided for informational and educational purposes only, and should not be relied upon as legal, business, investment, or tax advice. Furthermore, references to any securities or digital assets are for illustrative purposes only and do not constitute an investment recommendation or offer to provide investment advisory services. Factomind cannot be responsible for your use of the information provided in this content. Factomind has established, maintained, and enforced strict internal policies and procedures designed to identify and effectively manage conflicts of interest related to its business activities. Factomind does not own any digital assets mentioned below, nor has it made any purchases or sales of the digital assets mentioned below.
1. Introduction
We handpicked frequently asked questions regarding community building from global founders we met, and wrote data-driven reference points for each question. Which one is more sustainable, an airdrop based on stakes or a fairdrop? Should Gaming projects prioritize listing on CEXes to preparing alpha build reveal? How should founders respond to strong criticisms on social media? We will address the top 10 FAQs one by one and provide answers accordingly.
2. Data Overview
Data Specification
We selected 21 tickers from our master database based on the following criteria:
– Market capitalization
– Data history and completeness
– Sector representativeness, and first-of-its-kind status
– Community diversity
We then subdivided the selected tickers into four sectors: L1, DeFi, Gaming, and Meme, to check for contingent sectoral characteristics.
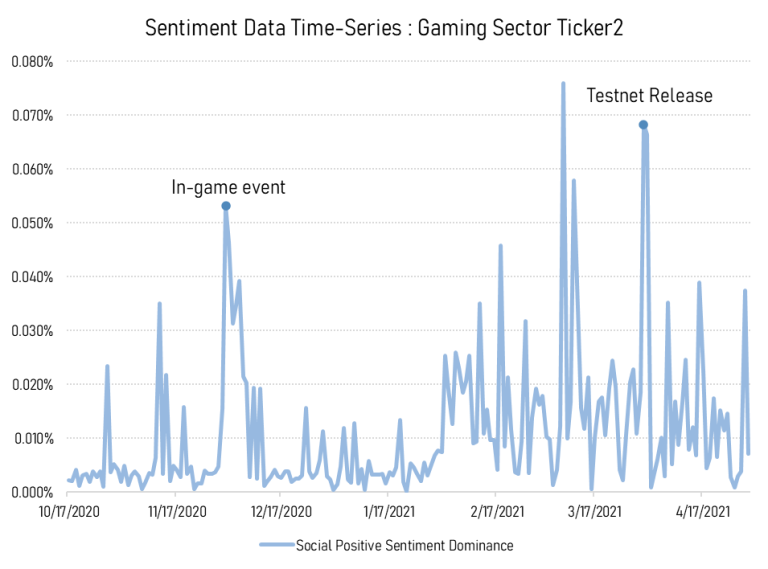
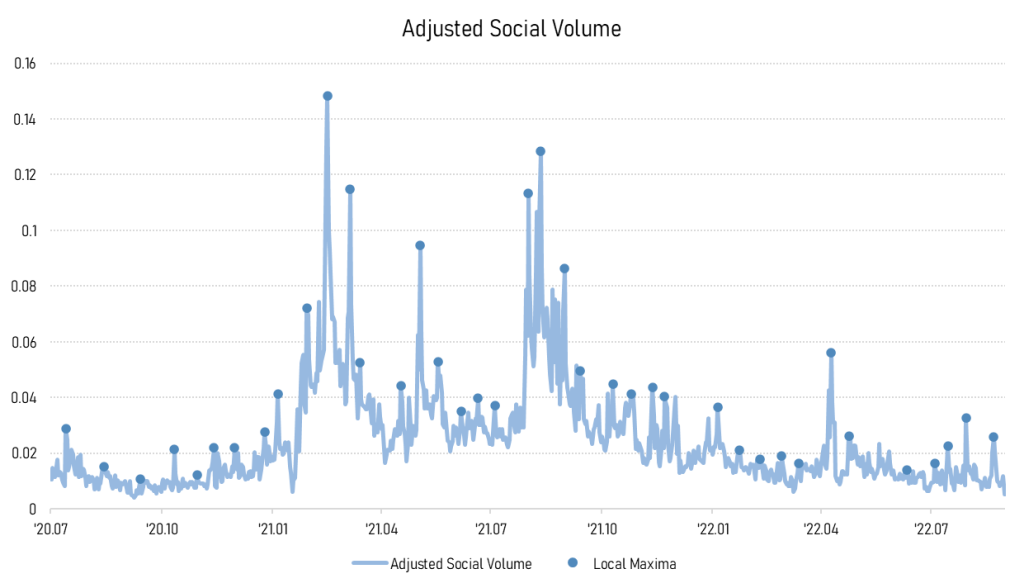
We gathered five data columns for each ticker: positive social volume, negative social volume, total social volume, whale transactions, and active addresses. Numbers are converted to relative terms as in ‘social dominance’ instead of ‘social volume’ for normalization, so no raw data is used in this paper. Our processed time-series data looks like Figure 1.
Circles in the graph below identify local maxima in negative social dominance, to which we assigned corresponding news based on the news categorization criteria (Table 1). For scraping news data, we only used official announcements from the respective foundations or from key figures as news.
We processed data for all five columns accordingly. Our final sample dataset comprises 21 tickers over 4752 days with 2936 signals paired with 2010 news announcements (Table 2).
Figure 1 – Time-series Data of Adjusted Social Volume for a Ticker
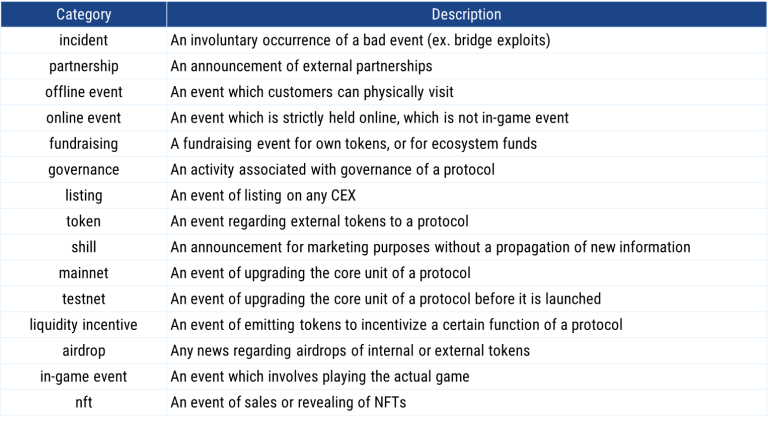
Table 1 – News Category CLassification Criteria
Table 2 – Data Summary
Please refer to Appendix for the exact processes of data selection and data conversion.
FAQ Specification
We also gathered all questions from founders we met, abridged them into 10 based on frequency and significance. This process has been done qualitatively. For any inquiries on the questions beyond the scope of this paper, please contact us directly.
3. Ten Commandments for Efficient and Sustainable Community Building
3.1. Haters gonna hate
Crypto industry is unprecedented in proximity of founders to customers. Founders are encouraged to be sensitive to community feedback, and of course they have to confront negative, sometimes harsh, feedback. They sometimes wonder to what extent they should accommodate the negative feedback to their projects: A complete overhaul? A minor modification? Or full ignorance?
The data saith, “Thou shalt not be cast into disarray by the voices of the doubters.”
(or in modern language, “Do not spend too much energy on bad sentiments.”)
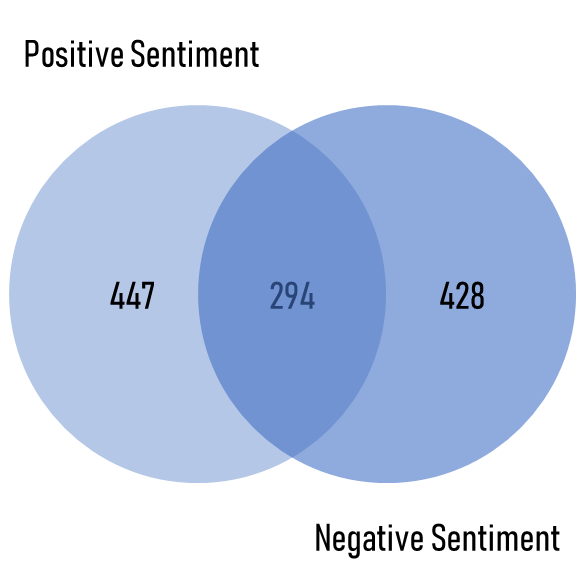
Positive feedback often entails an evil twin. By looking at which news triggered each sentiment signal*, and how many of them simultaneously triggered both positive and negative signals, we could find the intersection between two sentiments.
*a local maxima in sentiment dominance; refer to Figure 1
As visible from Figure 2, 39.7% of positive signals coincided with negative signals, indicating that two opposite responses often overlap, regardless of the source news being essentially bullish to projects or not.
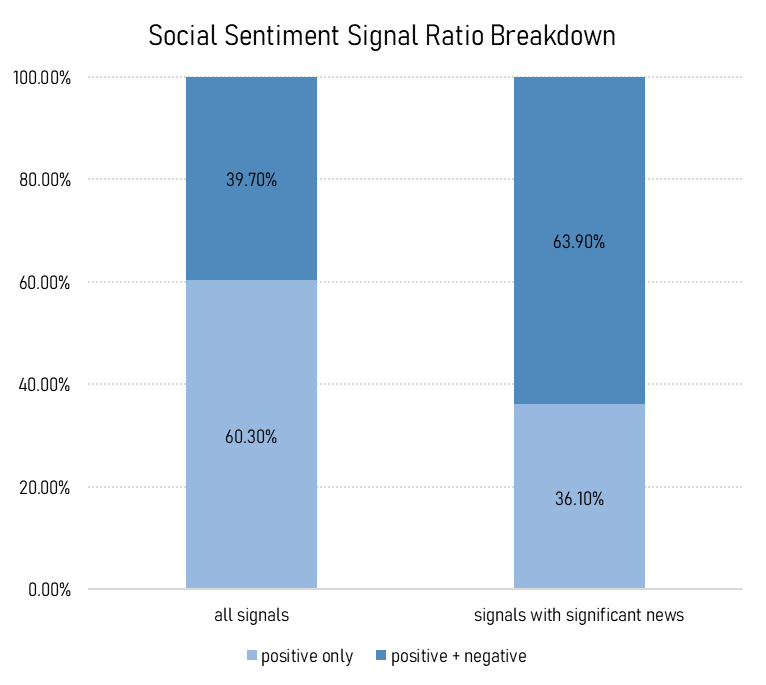
If we filter out trivial news or snobby shills on Twitter, the result is even more appalling: Negative sentiment stalks positive sentiment for the significant, beneficial news (Figure 3).
Figure 2 – A Venn Diagram for Overlapping* Sentiment Signals
*Overlapping : Signal days with both positive and negative signals triggered
Figure 3 – Comparing Overlapping Signals with Significant* News to All Overlapping Signals
*partnerships with notable entities; refer to Appendix for detailed description
Since abusive comments on social media will be present regardless of information, instead of coping with bad sentiments, builders are better off by focusing on enhancing positive media sentiments. Conversely, a strong negative sentiment might not necessarily be a bad omen as long as it accompanies a robust positive sentiment.
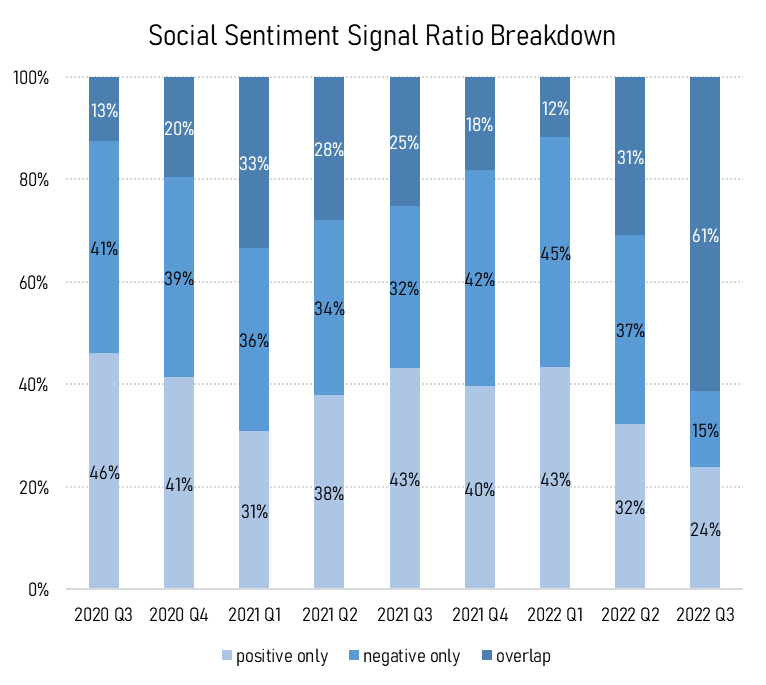
Figure 4 – A Quarterly Time-Series for Overlapping Ratio
One interesting fact is that, we could see the overlapping ratio between positive and negative signals drastically increasing as time evolves (Figure 4). The trend is more obvious recently, perhaps because overall scales of communities got larger. The data suggests we should pay even less attention to negative responses we meet in the bear market—haters gonna hate.
3.2. Quality matters
Who would hate to partner with big names after big names, and list their tokens on the most prominent exchanges? But in reality, we are constrained to resources (time and money). The realization brings us to a dilemma: Should we focus on one great news, or on delivering consistent news?
The data saith, “Though thy origins be singular, thine ultimate destiny shall surpass the measure of twentyfold.”
(or in modern language, “It is better to aim high and hit one, than to aim low and hit twenty.”)
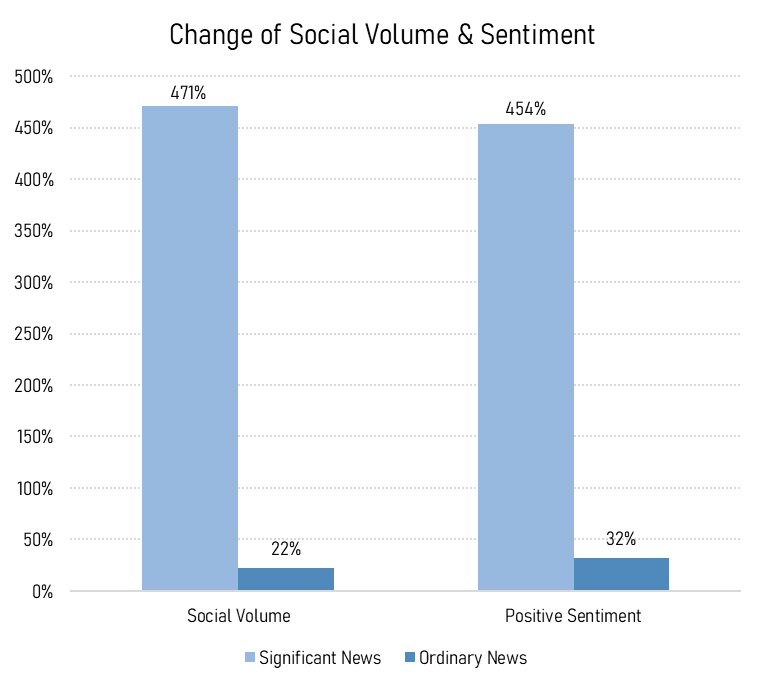
It is better to aim high and hit one, than to aim low and hit twenty. Comparing the growth in social volume dominance under quality partnerships* to the growth under mediocre partnerships, we can capture quality over quantity, or vice versa.
*partnerships with notable entities; refer to Appendix for detailed description
Quality partnerships draw roughly 20 times more attention than ordinary partnerships (Figure 5). In easy words, a Tier 1 CEX* listing announcement generates the same percentage change in buzz as listing announcements in 20 non-Tier 1 exchanges added together.
*Do you want to know which exchanges are classified as Tier 1? Tip : Contact us! (Warning : You might be surprised)
Figure 5 – Changes in Sentiments Under Quality Partnerships
The gap becomes even more dramatic when we take the longevity of sentiment improvements into account (Read onto Commandment 8 for this). We could build a mental model upon this finding: To focus on a single decent partnership than to use up those resources for 20 mediocre ones. Intensity beats consistency this time.
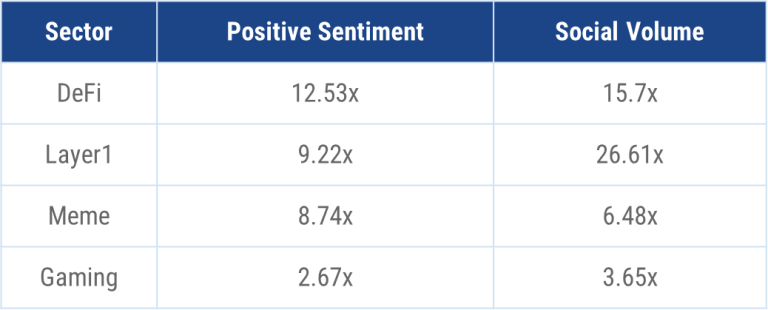
Table 3 – Effective Coefficient* per Sector
*Effective Coefficient = Change under Significant News / Change under Ordinary News
To give a more detailed inspection, sector-wise, L1s are the most sensitive to listings and partnerships, which is coherent to our knowledge that the main business goal of L1s is to expand their ecosystems. Other sectors respond to quality partnerships to a lesser extent, but still do so by tenfold.
Still, Gaming sector seems to be much less enthusiastic about quality partnerships as indicated by the lowest effective coefficient. Focusing on a single quality partnership might not be the best strategy if you are building games. What features of Gaming differentiates it from other sectors? If curious, please read onto the next Commandment.
3.3. A picture is worth a thousand words
You are building a great game, and you want people to notice it. Should you secure a sponsor spot in KBW (yes, it’s one of the greatest events co-hosted by our frens at Hashed!) to host an offline side event? Or should you run an online AMA with the L1 foundation you are building on?
The data saith, “Craft unto thyself an effigy, and it shall possess a worth surpassing a myriad of spoken phrases.”
(or in modern language, “Visual appeals are your best friend for marketing.”)
Users, especially gamers, love visible progress. The greatest rises in sentiment dominance of game projects were often paired with visual productions, such as gameplay teasers or playtest builds.
Gamers want to see what they can play in the future. In Web 3, gamers are involved with a Gaming project at an early stage, we should thus attempt to preserve the initial hype by continuously sharing visible progress during the years of development. A simple shill with visual specs could do magic to fill the gap.
We will look at percentage changes in sentiment dominance to study which news categories draw more attention in comparative terms, to verify our assertions.
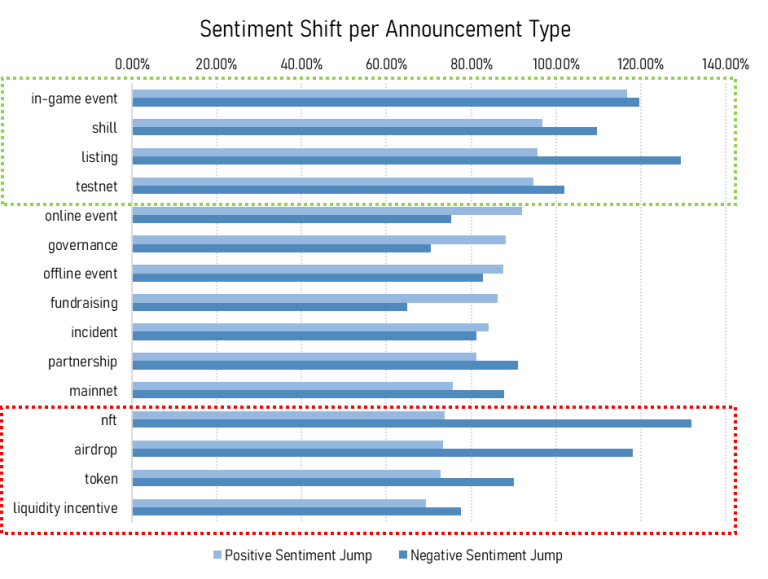
Scanning through the top categories in order of mean percentage changes in dominance (Figure 8), we can easily spot our candidate—listings, as they are pertinent to direct financial benefits. However, we can also see in-game events, shills, and testnets faring quite well on the upper side. The percentage growth of positive sentiment is even greater for in-game events than listing!
To recall our point from Commandment 2, sentiments get boosted the most by significant listing and partnership announcements. Nonetheless, in the Gaming sector, in-game events are comparable to such quality news in terms of percentage sentiment changes.
Figure 8 – Mean Percentage Change in Sentiments per News Category
L1/DeFi projects are conceptual, pragmatic products, thus users are apt to evaluate projects based on usability of their respective functions. For Gaming projects, however, the using experience itself becomes the core product for users. Hence, in-game events or testnet-style leaks appeal to gamers as much as hefty partnerships, and help to maintain the uplifted sentiments.
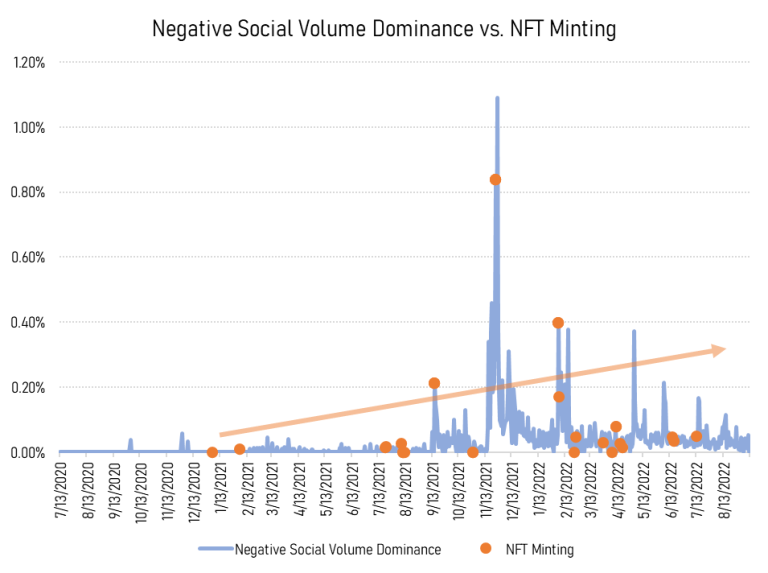
If we look at the bottom of Figure 8, yet one insight stands out: Negative sentiment towards NFT sales. NFTs are ranked 12th in positive sentiment change, but top the list of negative sentiment change. A possible explanation could be that, as NFTs have been increasingly used for viral marketing throughout the last boom cycle, customers were worn out about NFTs flooding the market.
NFTs are a double edged sword; they could stir up a nice response, but much more in a negative way. Thus, we should be careful when deciding on NFT minting strategies, as they may collect a good deal of hashtags, at the expense of possible backlash.
Figure 9 – Negative Social Volume Dominance vs. NFT Minting
Even for an NFT game project, to which NFTs are accepted to be essential, repetitive sales of NFTs for the sake of selling the NFTs are prone to facing negative repercussions. When approving NFT sales as a marketing strategy or as a fundraising scheme, it is advisable to finish the mint at once. There are few sales strategies which could work for multiple mints, however, and please reach out to us if you are curious.
3.4. Chicken first, or egg first
You thought you had built a raving community. As soon as your token price drops, you see nobody is active on your Discord, and realize that those hypes were only transitory due to price rallies. You might regret: “Had I known these hypes were all transitory, and not of genuine devotion, I would have focused more on the community.”
The data saith, “Thou believe not every spirit, but try the spirits whether they are of truth.”
(or in modern language, “Distinguish between transitory hype due to price rallies and sentiment improvements due to fundamental growths.”)
Social media sentiment may fluctuate without any news announcement. A part of sentiment volatility could be attributed to price volatility—sometimes, a price rally tells a much larger story than a 100-page whitepaper. Counting the frequency of sharp rallies (or sell-offs)* conditional on ‘no news’ signal days can grant us knowledge on how often sentiments react solely to price moves.
*Please refer to Appendix for the definition of sharp rallies/sell-offs
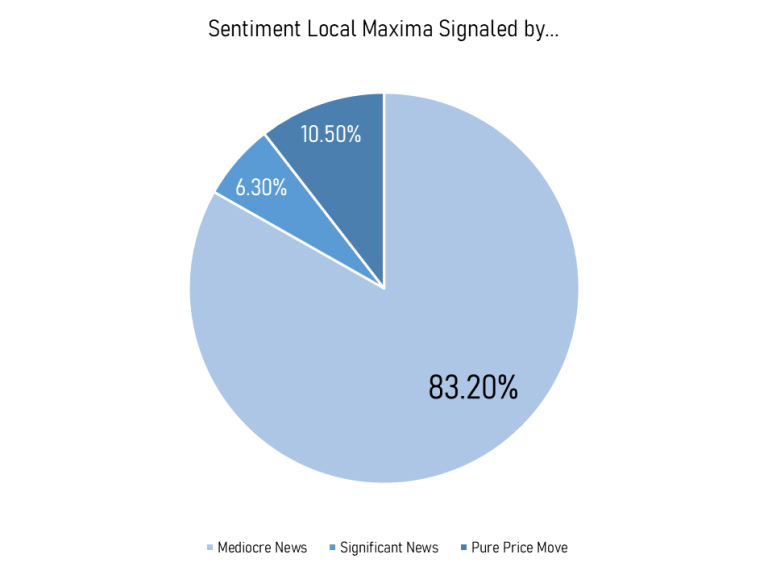
Figure 10 – Proportion of Local Maxima Signaled by Pure Price Moves to Total News Count
Out of all the meaningful signals, by which we mean signals with any information (or news) attached, 83.2% accompanied insignificant* news, 6.3% accompanied significant news, and 10.5% accompanied price volatility**. Conversely, we could extrapolate that around 10% of ‘news days’ signals might have been triggered by price movements.
*partnerships with non-notable entities; refer to Appendix for detailed description
**for the definition of days with volatile prices, refer to Appendix
Even without any news, price volatility is enough to excite vigorous response in the SNS, effectively masking or boosting any good news founders would like to propagate. Thus, it is crucial to distinguish between sentiment growth based on project fundamentals and transitory buzz hypes due to price rallies, to avoid overestimating of the community size and to make a right diagnosis to bring the community together.